Fig. 2
Download original image
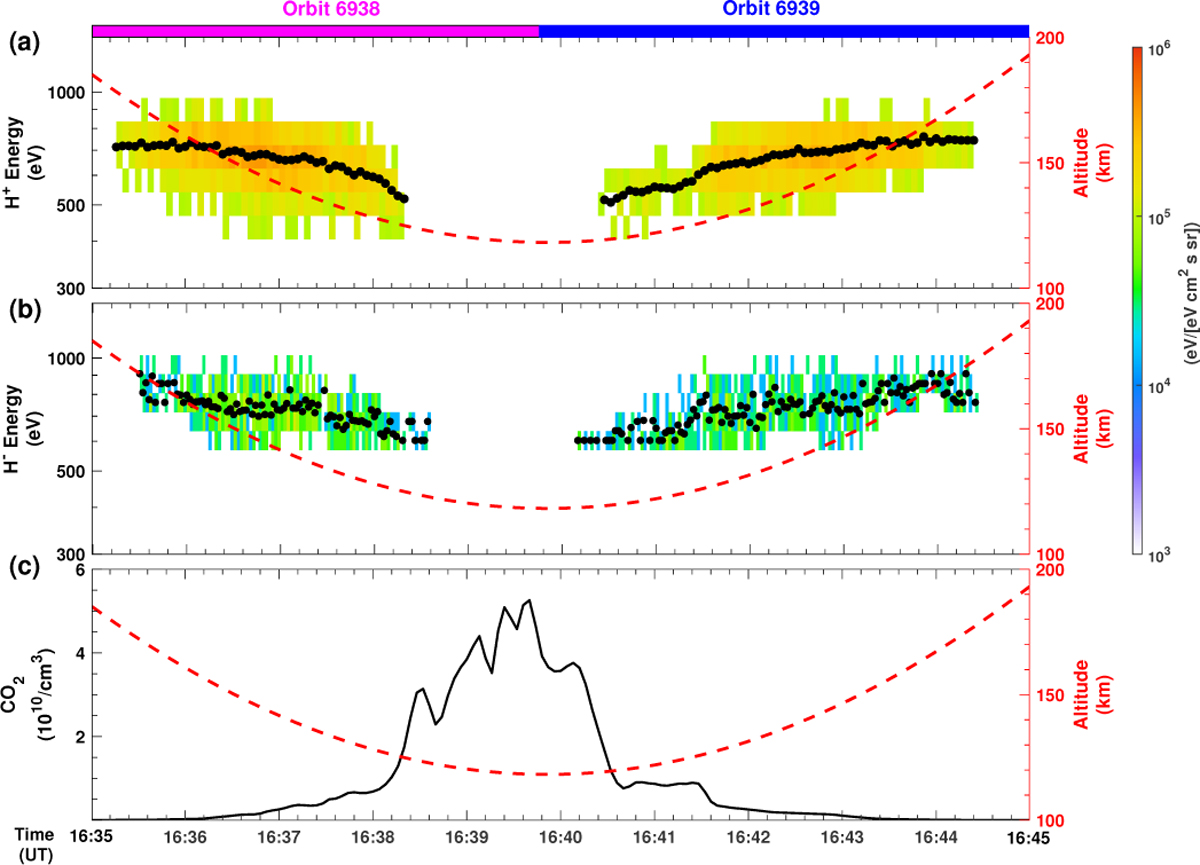
Temporal evolutions of (a) the corresponding H+ energy spectrum, (b) the H− energy spectrum, and (c) CO2 density variation measured by NGIMS during the H-ENA penetration event on 24 April 2018. The altitude of the MAVEN spacecraft is plotted with the dashed red line on the right axis. The weighted average energies obtained from H+ and H− count-energy distributions within 4-second and 2-second time windows are represented by the black dots. The horizontal magenta and blue bars at the top of Fig. 2 represent orbits 6938 and 6939, respectively.
Current usage metrics show cumulative count of Article Views (full-text article views including HTML views, PDF and ePub downloads, according to the available data) and Abstracts Views on Vision4Press platform.
Data correspond to usage on the plateform after 2015. The current usage metrics is available 48-96 hours after online publication and is updated daily on week days.
Initial download of the metrics may take a while.