Fig. 3
Download original image
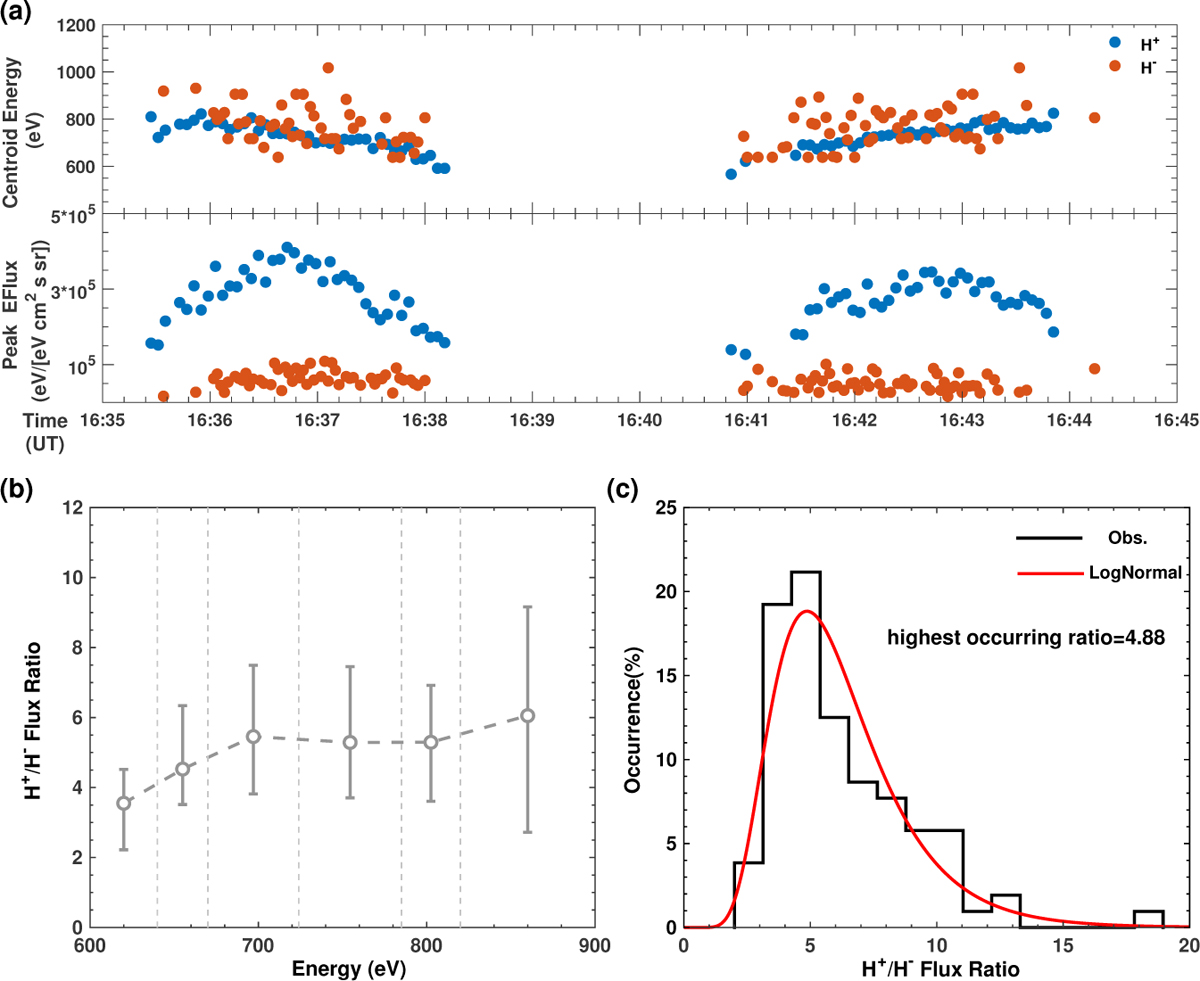
(a) Gaussian-fit centroid energies and peak fluxes of H+ and H− at each time step are shown. H+ and H− data are represented by solid blue and orange points, respectively. (b) The gray circles show the H+/H− flux ratio at the central energy of each bin, and the vertical error bars represent the quartile-based bounds. Vertical dashed gray lines indicate the bin boundaries, while the dashed gray line shows the overall trend of the H+∕H− flux ratio. (c) Percentage distribution of H+∕H− flux ratios. The most frequently occurring ratio is 4.88. The log-normal fit to this distribution is shown by the red curve.
Current usage metrics show cumulative count of Article Views (full-text article views including HTML views, PDF and ePub downloads, according to the available data) and Abstracts Views on Vision4Press platform.
Data correspond to usage on the plateform after 2015. The current usage metrics is available 48-96 hours after online publication and is updated daily on week days.
Initial download of the metrics may take a while.