Fig. 4
Download original image
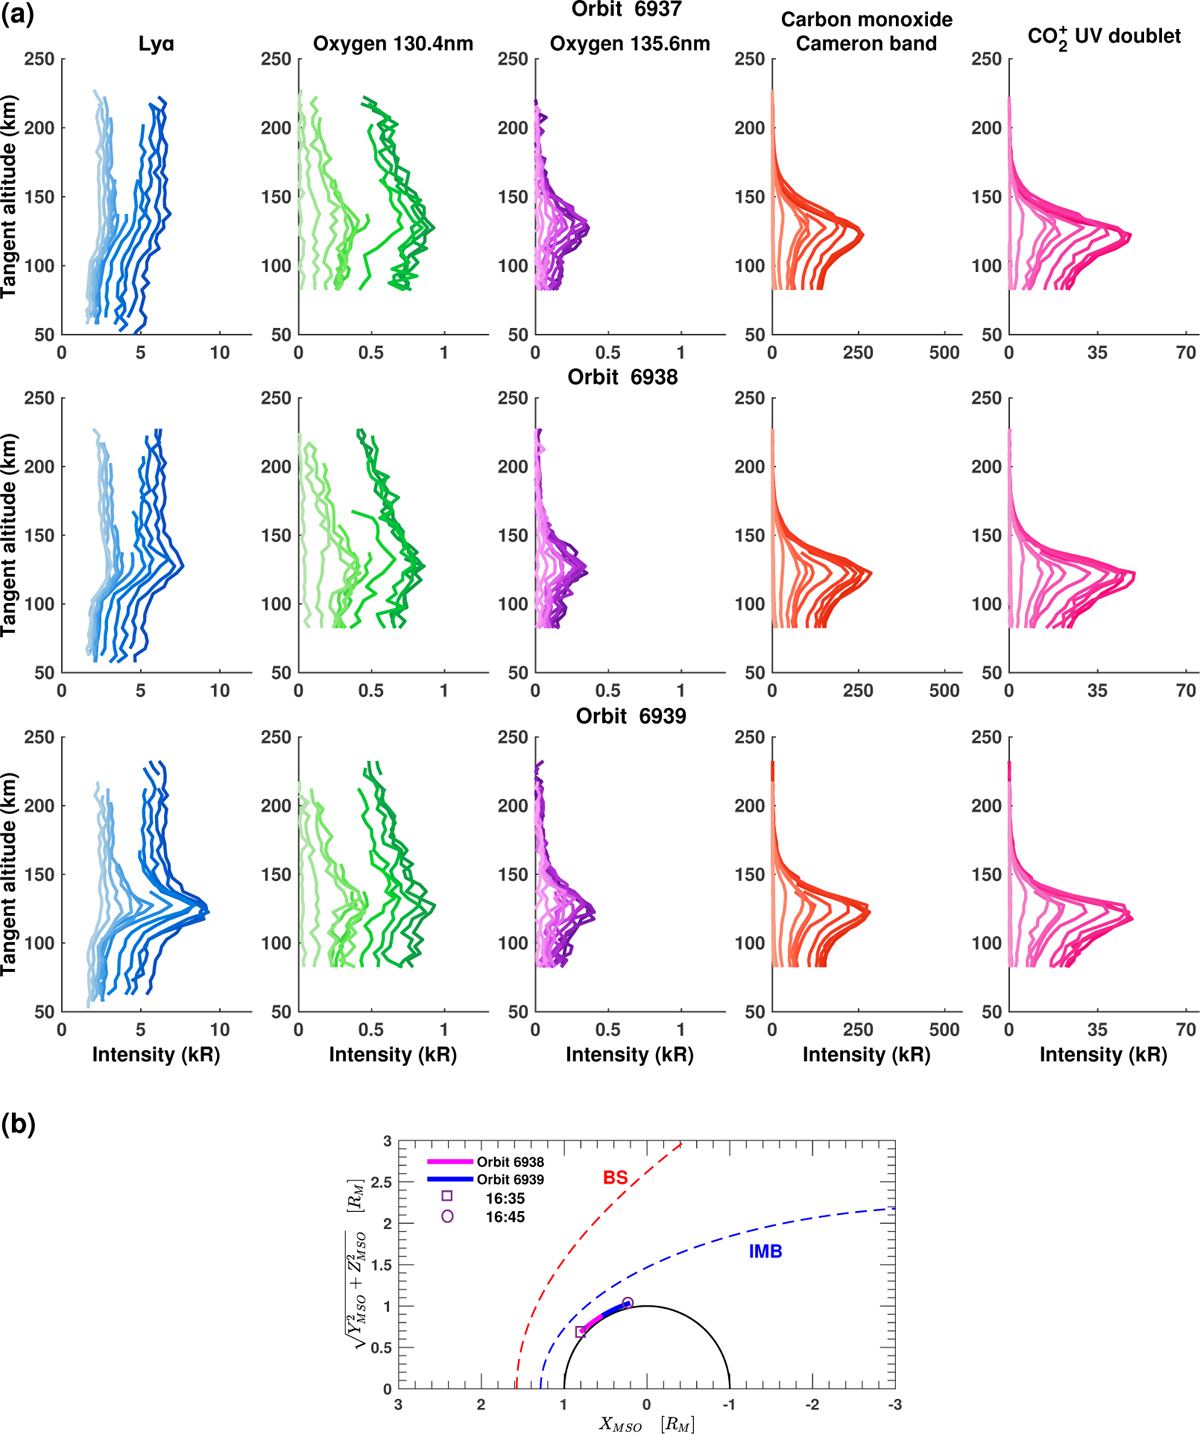
IUVS limb observations for the emission intensity profiles of Ly-α and CO2 ionization and dissociation emissions during orbits 6937, 6938, and 6939. Each panel contains 12 profiles from 12 limb scans indicated by varying color intensities. MAVEN trajectories during the H-ENA penetration event within (b) (![]() ) coordinate plane are plotted in units of Martian radii (RM). In Fig. 4b, the solid magenta and blue lines represent the MAVEN orbital trajectories 6938 and 6939 respectively, recorded during the H+ and H− event from 16:35 to 16:45 UT on 24 April, 2018. The dashed red and blue lines indicate the BS and IMB, which were calculated using the model of (Trotignon et al. 2006).
) coordinate plane are plotted in units of Martian radii (RM). In Fig. 4b, the solid magenta and blue lines represent the MAVEN orbital trajectories 6938 and 6939 respectively, recorded during the H+ and H− event from 16:35 to 16:45 UT on 24 April, 2018. The dashed red and blue lines indicate the BS and IMB, which were calculated using the model of (Trotignon et al. 2006).
Current usage metrics show cumulative count of Article Views (full-text article views including HTML views, PDF and ePub downloads, according to the available data) and Abstracts Views on Vision4Press platform.
Data correspond to usage on the plateform after 2015. The current usage metrics is available 48-96 hours after online publication and is updated daily on week days.
Initial download of the metrics may take a while.