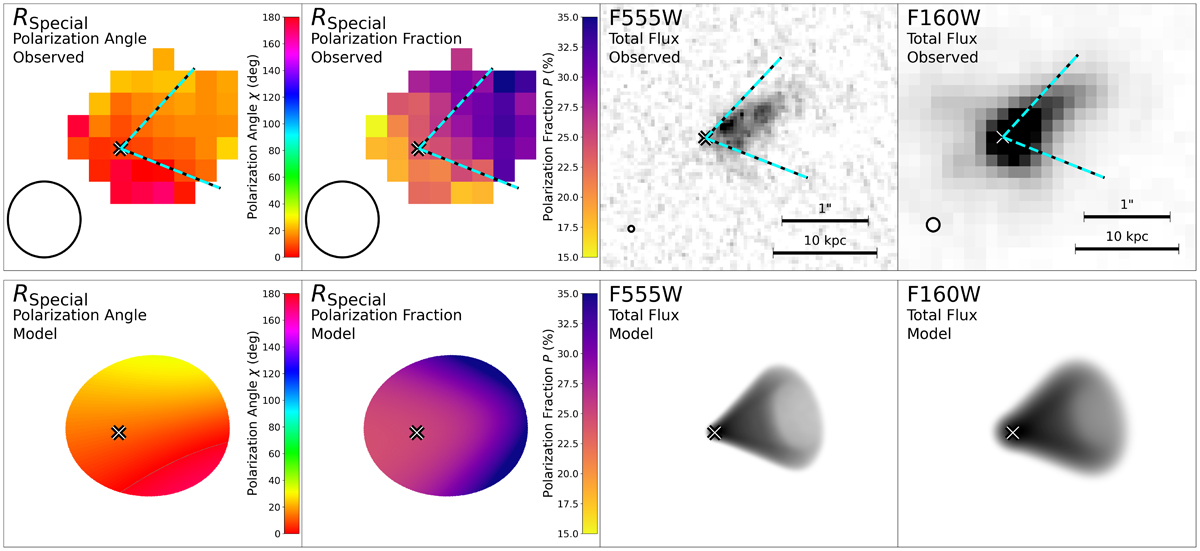
Fig. 2.
Download original image
Top-left panels: Resolved maps of the polarization angle and fraction of W0204-0506 measured with FORS2. Polarization values are shown for every pixel where the combined flux from all PSF-matched o- and e-beam images is detected above 5σ. Top-right panels: HST/WFC3 images in the F555W and F160W bands. All cutouts have a size of 3″ × 3″ and have been astrometrically aligned using stars within the field of view. The cross shows the position of the brightest F160W pixel in all panels. The dashed cyan-black lines in all top panels mark the edges of a cone with ψCone = 40 deg and an axis length of 10 kpc projected by the 60 degree inclination of the model (see Sect. 4 for details). Bottom: Representative best-fit model intensity and polarization maps, convolved with the FORS2, F555W, or F160W PSF as appropriate. The cross shows the position of the quasar.
Current usage metrics show cumulative count of Article Views (full-text article views including HTML views, PDF and ePub downloads, according to the available data) and Abstracts Views on Vision4Press platform.
Data correspond to usage on the plateform after 2015. The current usage metrics is available 48-96 hours after online publication and is updated daily on week days.
Initial download of the metrics may take a while.