| Issue |
A&A
Volume 702, October 2025
|
|
|---|---|---|
| Article Number | A124 | |
| Number of page(s) | 8 | |
| Section | Extragalactic astronomy | |
| DOI | https://doi.org/10.1051/0004-6361/202555245 | |
| Published online | 16 October 2025 | |
A massive gas outflow outside the line of sight: Imaging polarimetry of the blue excess Hot Dust-Obscured Galaxy W0204–0506
1
Instituto de Estudios Astrofísicos, Facultad de Ingeniería y Ciencias, Universidad Diego Portales, Av. Ejército Libertador 441, Santiago, Chile
2
Astronomical Observatory, Volgina 7 11060 Belgrade, Serbia
3
Sterrenkundig Observatorium, Universiteit Gent, Krijgslaan 281-S9, Gent B-9000, Belgium
4
Caltech/IPAC, 1200 E. California Blvd., Pasadena, CA 91125, USA
5
Instituto de Alta Investigación, Universidad de Tarapacá, Casilla 7D, Arica, Chile
6
Department of Physics and Astronomy, University of Leicester, University Road, Leicester LE1 7RH, UK
7
Cahill Center for Astronomy and Astrophysics, California Institute of Technology, 1200 E. California Boulevard, Pasadena 91125, CA, USA
8
Institute of Astrophysics, Foundation for Research and Technology-Hellas (FORTH), Heraklion 70013, Greece
9
School of Sciences, European University Cyprus, Diogenes street, Engomi 1516, Nicosia, Cyprus
10
Jet Propulsion Laboratory, California Institute of Technology, Pasadena, CA 91109, USA
11
Department of Physics, University of Crete, 70013 Heraklion, Greece
12
Department of Physics, Northwestern College, 101 7th St SW, Orange City, IA 51041, USA
13
National Astronomical Observatories, Chinese Academy of Sciences, 20A Datun Road, Chaoyang District, Beijing 100101, China
14
University of Chinese Academy of Sciences, Beijing 100049, People’s Republic of China
15
School of Astronomy and Space Science, University of Chinese Academy of Sciences, Beijing 100049, China
16
Institute for Frontiers in Astronomy and Astrophysics, Beijing Normal University, Beijing 102206, China
17
Centre for Astrophysics Research, University of Hertfordshire, College Lane, Hatfield AL10 9AB, UK
18
Centre for Space Research, North-West University, Potchefstroom 2520, South Africa
⋆ Corresponding author: This email address is being protected from spambots. You need JavaScript enabled to view it.
Received:
22
April
2025
Accepted:
11
July
2025
Abstract
Aims. Hot Dust-Obscured Galaxies (Hot DOGs) are a population of hyper-luminous, heavily obscured quasars. Although nearly Compton-thick nuclear obscurations are typical for Hot DOGs, a fraction show blue UV spectral energy distributions consistent with unobscured quasar activity, albeit two orders of magnitude fainter than expected from their mid-IR luminosity. The origin of the UV emission in these blue excess Hot DOGs (BHDs) has been linked to scattered light from the central engine. Here we study the properties of the UV emission in the BHD WISE J020446.13–050640.8 (W0204–0506).
Methods. We used imaging polarization observations in the RSpecial band obtained with the FORS2 instrument at VLT. We compared these data with radiative transfer simulations to constrain the characteristics of the scattering material.
Results. We find a spatially integrated polarization fraction of 24.7 ± 0.7%, confirming the scattered-light nature of the UV emission of W0204–0506. The source is spatially resolved in the observations, and we find a gradient in polarization fraction and angle that is aligned with the extended morphology of the source found in HST/WFC3 imaging. A dusty, conical polar outflow starting at the active galactic nucleus sublimation radius with a half-opening angle of ≲50 deg viewed at an inclination ≳45 deg can reproduce the observed polarization fraction if the dust is graphite-rich. We find that the gas mass and outflow velocity are consistent with the range of values found for [O III] outflows through spectroscopy in other Hot DOGs, though it is unclear whether the outflow is energetic enough to affect the long-term evolution of the host galaxy. Our study highlights the unique potential of polarization imaging for studying dusty quasar outflows and providing complementary constraints to those obtained through traditional spectroscopic studies.
Key words: polarization / galaxies: evolution / quasars: individual: WISE J020446.13-050640.8
© The Authors 2025
 Open Access article, published by EDP Sciences, under the terms of the Creative Commons Attribution License (https://creativecommons.org/licenses/by/4.0), which permits unrestricted use, distribution, and reproduction in any medium, provided the original work is properly cited.
This article is published in open access under the Subscribe to Open model. This email address is being protected from spambots. You need JavaScript enabled to view it. to support open access publication.
1. Introduction
Quasar activity is thought to be important in regulating, and eventually suppressing, the stellar growth of massive galaxies (e.g., Di Matteo et al. 2005). During this period of intense accretion, the quasar is expected to drive massive outflows that will heat the interstellar medium (ISM), lowering the efficiency of star formation (SF) and depleting the gas reservoir of the host galaxy, which in turn limits its future SF history. Such effects should be more noticeable in the most luminous quasars known, and indeed many studies have found massive ionized gas outflows in such objects (e.g., Harrison et al. 2016; Zakamska et al. 2016; Bischetti et al. 2017; Temple et al. 2019; Vayner et al. 2024).
Hot Dust-Obscured Galaxies (Hot DOGs; Eisenhardt et al. 2012; Wu et al. 2012) are some of the most luminous (LBol > 1013 L⊙, with 10% exceeding LBol > 1014 L⊙; Tsai et al. 2015), obscured (2.5 ≲ E(B − V)≲30; Assef et al. 2015) quasars known in the Universe, and indeed display an array of features that suggest strong feedback is occurring. They seem to have high supermassive black hole masses for their stellar masses as well as higher Eddington ratios compared to similarly luminous type 1 quasars Li et al. 2024, which potentially increases the effects of the quasar on the host galaxy. Hot DOGs show massive, fast outflows (up to ∼10 000 km s−1) detected in the [O III] λ5007 Å emission line Jun et al. 2020; Finnerty et al. 2020; Vayner et al. 2025 with mass outflow rates of up to ∼104 M⊙ yr−1 as well as slower yet powerful outflows detected in the [C II] λ158 μm emission line Díaz-Santos et al. 2016; Liao et al. 2025. These outflows may be powering the strong turbulence found in the far-IR emission line across the host galaxies of these obscured quasars (Díaz-Santos et al. 2016, 2021, Liao et al., in prep.).
Analysis of Hot DOG spectral energy distributions (SEDs) using the SED templates of Assef et al. 2010 shows that some of them have blue emission in excess of the maximum SF allowed by those templates, indicating that – in addition to the hyper-luminous, heavily obscured quasar needed to account for the bright mid-IR emission – a second unobscured or lightly obscured template with ∼1% the luminosity of the obscured component is required Assef et al. 2016. We refer to these objects as blue excess Hot DOGs (BHDs); Li et al. 2024 find that BHDs may account for as much as 25% of all Hot DOGs. Detailed studies of a few objects Assef et al. 2016, 2020 concluded that this blue emission originates from scattered light from the hyper-luminous obscured quasar. Via imaging polarimetry of one of these objects (WISE J011601.41–050504.0, W0116–0505 hereafter), its UV continuum was found to have a polarization fraction of 10.8 ± 1.9% (Assef et al. 2022, A22 hereafter), consistent with the scattering scenario. Similar conclusions have been reached for other objects with similar SEDs Alexandroff et al. 2018; Stepney et al. 2024.
In this article we present imaging polarimetric observations for another BHD, WISE J020446.13–050640.8 (W0204–0506 hereafter). In contrast to the results for W0116–0505 by A22, our observations for W0204–0506 spatially resolve the source, providing a map of the structures responsible for the scattering. In Sect. 2 we present the photometric, spectroscopic, and polarimetric observations we used in this study. In Sect. 3 we present the linear polarization fraction and angle of the source, both spatially integrated and resolved, and in Sect. 4 we interpret these observations. In a companion paper (Assef et al., in prep.), we present spatially unresolved polarimetric observations for a sample of BHDs. We assume a concordance flat ΛCDM cosmology with H0 = 70 km s−1 Mpc and ΩM = 0.3 throughout the article.
2. Observations
2.1. Imaging polarimetry
Imaging polarimetry observations of W0204–0506 in the RSpecial band were obtained using the FOcal Reducer/low dispersion Spectrograph 2 (FORS2) instrument at the Very Large Telescope (VLT) as part of the program 111.24UL. The observations were divided into two observing blocks (OBs), carried out on the nights of UT 2023 September 20 and 22 under clear conditions with average seeing values of 0.6″ and 0.8″, respectively. Observations on both nights where obtained with a mean airmass of 1.1. Each OB consisted of 2 × 353 s exposures at retarder plate angles of 0, 22.5, 45, and 67.5 deg. Observations of standard stars using the same set of retarder plate angles are regularly obtained by the observatory. We also analyzed the observations of the zero polarization standards WD 2039–202 and WD 2359–434 obtained on the night of UT 2023 September 14, as well as observations of the polarization standard Vela1 95 obtained on the night of UT 2023 October 21. The latter is the polarization standard observed closest in time to W0204–0506 that was not saturated or heavily out of focus.
We followed A22 and used the EsoRex1 pipeline to subtract the bias. Cosmic rays were removed using the Python package Astro-SCRAPPY McCully et al. 2018, which is based on the algorithm of van Dokkum 2001.
The polarization fraction and angle are generally obtained following the approach outlined by A22, which follows that outlined in the FORS2 User Manual and includes the background polarization corrections from González-Gaitán et al. 2020. In short, we used the flux of the source measured in the ordinary and extraordinary beams, fo(θi) and fe(θi) for a retarder plate angle of θi, to estimate the Stokes Q and U parameters. The polarization fraction is then given by
 (1)
(1)
and the polarization angle by
 (2)
(2)
An additional step we have taken here is to align and match the point spread function (PSF) between the images before extracting fo(θi) and fe(θi) to ensure our results are not affected by pointing jitter or changes in the PSF. For the target source these corrections are small, as the pointing jitter is less than a pixel and the PSF varies by less than 0.1″ within an OB. For the science target images we used the ImageMatch2 software from Carnegie Observatories. This approach does not work properly for the standards as those observations are much shallower, limiting the number of well-detected stars in the field of view to estimate the PSF shape. Instead we just convolved the standard star images to a common PSF assuming a 2D Gaussian shape using the make_2dgaussian_kernel function of photutils and the convolve routine from astropy. Note, however, that if we do not apply these PSF-matching steps our results are not qualitatively affected.
2.2. Spectroscopy and broadband photometry
Spectroscopic observations of W0204–0506 obtained with the GMOS-S instrument at the Gemini South Observatory are presented in Assef et al. 2016. The source shows broad C IVλ1549 Å and C III] λ1909 Å emission lines, which are typical of type 1 quasars. However, the spectrum also displays bright He IIλ1640 Å emission with an equivalent width comparable to that of C IV and C III], which is unusual in type 1 quasars (e.g., Vanden Berk et al. 2001), but common in radio galaxies (e.g., Stern et al. 1999). With an updated procedure to improve the error spectrum that will be presented in an upcoming study by Eisenhardt et al. (in prep.), we modeled the emission lines using single Gaussian profiles with a power-law continuum, similar to the approach described in Assef et al. 2020. Given that broad UV emission lines are usually seen to be blueshifted in type 1 quasars in general (see, e.g., Decarli et al. 2018) and in Hot DOGs in particular Díaz-Santos et al. 2021, we used the narrower He II emission line alone to determine the redshift for this source, z = 2.0993 ± 0.0003. For reference, with respect to this redshift, the C IV and C III] emission lines are blueshifted by about 200 km s−1 and 50 km s−1, respectively. We measure full width at half maximum (FWHM) velocities of  for C IV,
  for He II, and
  for C III], which are broadly consistent with those reported by Assef et al. 2016.
Photometric data.
Figure 1 shows the broadband SED of the source constructed from combining the profile-fitting fluxes of the WISE W1 and W2 bands from the CatWISE2020 catalog Marocco et al. 2021 and the W3 and W4 bands from the WISE AllSky Data Release Cutri et al. 2012 with the modelmag fluxes of the u′ g′ r′ i′ z′ bands from the Sloan Digital Sky Survey (SDSS) Data Release (DR) 17 Abdurro’uf et al. 2022, the Petrosian aperture fluxes of the H and Ks bands from the Vista Hemisphere Survey (VHS) DR5 McMahon et al. 2021 and the fixed aperture fluxes of the Spitzer/IRAC [3.6] and [4.5] channels from Griffith et al. 2012. Additionally, we included photometry from the follow-up r-band and J-band observations discussed in Assef et al. 2020 and Assef et al. 2015, respectively. The fluxes for each band are shown in Table 1. Figure 1 also shows the best-fit SED model obtained using the templates of Assef et al. 2010, as described in Assef et al. 2016, consisting of one quasar component that is heavily obscured ( ) and very luminous (
 ) that dominates the mid-IR emission, one quasar component that is lightly obscured (
 ) and much less luminous (
 , i.e., about 1.3% of the luminosity of the obscured component) that dominates the UV/optical emission and an intermediate star-forming host galaxy component that dominates the near-IR. The numbers differ slightly from those presented by Assef et al. 2016 and Assef et al. 2020 due to the specific photometry used as well as the updated redshift value. The H-band photometry from VHS significantly deviates from the best-fit SED model, suggesting that the [O III] λ5007+4959 emission line has a larger equivalent width than the templates used. Based on the flux density difference, we estimate a combined equivalent width of the [O III] lines of about 1300 Å. This is consistent with the large outflows detected in Hot DOGs through this emission line by Jun et al. 2020 and Finnerty et al. 2020. We note that this has only a minor effect in the SED model. If we fit the SED without the H-band photometry, the luminosities of each of the active galactic nucleus (AGN) components change by less than 1% and we do not see any changes in the best-fit E(B − V) values. In the next sections we further discuss the presence of outflows in W0204–0506.
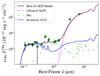 |
Fig. 1. SED of W0204–0506. The green circles show the measured flux densities and their 1σ uncertainties in the bands described in the text. The solid black line shows the best-fit SED model composed of a heavily obscured luminous AGN (dashed magenta line), a lightly obscured lower-luminosity AGN that accounts for the scattered light component (solid blue line), and a host galaxy from the Sbc template (dashed green line). The best-fit model has χ2 = 18, but that is mostly driven by the H-band VHS photometry, which is possibly affected by a large equivalent width of the [O III] λ5007+4959 emission line. Removing this band results in a best-fit model with χ2 = 11 with negligible changes to the parameter values. |
3. Linear polarization measurements
We first measured the spatially integrated linear polarization fraction and angle for the science target and the standard stars. For this, we measured the fo(θi) and fe(θi) in each image of each target through a circular aperture using photutils. We used a 2.0″ diameter for W0204–0506 and a 3.0″ diameter for the standard stars given the typically worse conditions they were observed in. For Vela1 95 we measure p = 7.79 ± 0.06% and χ = 171.8 ± 0.2 deg, which are close to the fiducial values of p = 7.89 ± 0.04% and χ = 172.1 ± 0.2 listed in the FORS2 documentation3. For the zero polarization standards WD 2039–202 and WD 2359–434 we measure respective polarization fractions of 0.04 ± 0.03% and 0.14 ± 0.10%, which are formally consistent with no polarization. The differences with the expected values suggest that the systematic errors in our measurements are, at most, a fraction of a percent.
For W0204–0506 we measure a spatially integrated polarization fraction of p = 24.7 ± 0.7% and a polarization angle of χ = 12.7 ± 0.8 deg. Splitting the observations by OB, we find consistent values of p = 25.2 ± 1.0% and χ = 12.4 ± 1.1 for the first night and p = 24.3 ± 0.8% and χ = 13.0 ± 1.0 for the second night. This is a much higher polarization fraction than the 10.8 ± 1.9% measured for W0116–0505 by A22 and compared to the other BHDs presented in the companion paper (Assef et al., in prep.), which range between ∼6% and ∼15%. Polarization fractions of up to ∼15% have been also found for extremely red quasars (ERQs) by Alexandroff et al. 2018. ERQs are closely related to BHDs, as discussed in Assef et al. 2020.
Our observations of W0204–0506 spatially resolve the polarization structure, as shown in Fig. 2. A significant gradient is observed in the polarization fraction p from about 20% in the southeast to about 30% in the northwest. The typical polarization fraction uncertainty in each pixel is about 4%. The gradient is also observed in the polarization angle χ, which shifts from about 0 to 20 degrees from the southeast to the northwest, with a typical uncertainty in each pixel of about 3 deg. This direction is aligned with the morphology observed in the Hubble Space Telescope (HST) Wide Field Camera 3 (WFC3) F555W and F160W imaging presented by Assef et al. 2020, as shown in Fig. 2. The figure marks the position of the brightest pixel in the F160W imaging (rest frame of ∼5200 Å) in all the bands, likely where the nucleus of the galaxy resides, and it is clear that the bulk of the emission in the F555W band (rest frame of ∼1800 Å) is toward the northwest of that position, overlapping with the highest polarization regions in the FORS2 RSpecial observations (rest frame of ∼2100 Å). We note that the contribution from SF to the UV emission must be negligible, as it would greatly reduce the polarization fraction; the measured values are too large to suspect dilution as they already exceed what is seen in other highly polarized quasars (e.g., Alexandroff et al. 2018). Considering the morphology and polarimetry maps, and the prevalence of massive outflows in Hot DOGs in general Jun et al. 2020; Finnerty et al. 2020, it seems that the rest-frame UV emission corresponds to light scattered from by dust entrained in a massive outflow almost perpendicular to the line of sight. The gradient in polarization could imply some dilution by starlight around the peak of the F160W flux, but in that case we would not expect a change in the polarization angle. The correlated change in polarization fraction and angle suggest that it could be scattered light from the opposite side of a biconical outflow, possibly obscured or modified by interaction with the ISM. A22 investigated the possibility that an outflow was acting as the scatterer in the case of W0116–0505 and concluded it was a viable and likely scenario. In the next section we investigate this scenario in more detail for W0204–0506.
 |
Fig. 2. Top-left panels: Resolved maps of the polarization angle and fraction of W0204-0506 measured with FORS2. Polarization values are shown for every pixel where the combined flux from all PSF-matched o- and e-beam images is detected above 5σ. Top-right panels: HST/WFC3 images in the F555W and F160W bands. All cutouts have a size of 3″ × 3″ and have been astrometrically aligned using stars within the field of view. The cross shows the position of the brightest F160W pixel in all panels. The dashed cyan-black lines in all top panels mark the edges of a cone with ψCone = 40 deg and an axis length of 10 kpc projected by the 60 degree inclination of the model (see Sect. 4 for details). Bottom: Representative best-fit model intensity and polarization maps, convolved with the FORS2, F555W, or F160W PSF as appropriate. The cross shows the position of the quasar. |
4. Discussion
4.1. Polarization medium
Zakamska & Alexandroff 2023 show that the high polarization fractions measured in ERQs can be explained if the scattering medium is outflowing. They propose that the scattering mechanism is a combination of Thomson scattering from free electrons for the continuum and resonant scattering for the emission lines, and that the scattering medium corresponds to the outer regions of a geometrically thick disk of ionized gas on scales of 10 pc. That physical scale is in stark tension with the ∼10 kpc scale of the scattering region in W0204–0506, with the caveat that their model is largely scale-independent. The main reason Zakamska & Alexandroff 2023 considered a very compact scale close to the accretion disk for the scattering medium is due to the difficulties in generating large polarization fractions with dust particles, which would be dominant on larger scales (at least at UV wavelengths; see Young et al. 1995 for a case where it could be important at near-IR wavelengths). Indeed, using the polarization fractions and scattering cross sections of Draine 2003 for Milky Way, Small Magellanic Cloud (SMC), and Large Magellanic Cloud (LMC) dust, we find that in the RSpecial band (rest ∼2100 Å), SMC- and Milky Way-type dust can yield a maximum polarization of about 10%, well below the measured p = 24.7 ± 0.7% for the spatially integrated emission of W0204–0506. For LMC-type dust this assessment is more complex as those grains can potentially produce up to ∼20% polarization fractions in backscattering but with very low scattering cross sections (see also Zakamska & Alexandroff 2023), making it difficult to account for the considerable fraction of AGN light scattered into the line of sight (1.3%; see Sect. 2.2). While the polarization fractions and scattering cross sections of Draine 2003 are approximate and somewhat inaccurate blueward of 2700 Å due to the phase function approximation used, we conclude it is unlikely that the scattering medium corresponds to typical dust in the ISM of a galaxy.
We can also rule out Thomson scattering from free electrons as the dominant scattering mechanism, as mentioned earlier, given the large physical size of the scattering medium. This is because dust grains should quickly form beyond the sublimation region of the shock-heated outflow gas. Once they form, dust grains will dominate the scattering properties given their much larger scattering cross section as compared to free electrons (see, e.g., the discussion in Assef et al. 2022). The only possibility left to consider is that the scattering is done by dust with very different properties than those of the Draine 2003 mixtures. To better assess which dust mixtures can reproduce our observations, we used the series of simulations that we discuss in the next sections.
4.2. Polarization for different dust mixtures
To compare different dust mixtures, we used the code SKIRT4 Baes & Camps 2015; Camps & Baes 2015, 2020. SKIRT is a state-of-the-art code for radiation transfer; it employs the Monte Carlo technique to emulate the relevant physical processes such as scattering, absorption, and emission, including polarization caused by scattering on spherical dust grains and electrons. Instead of relying on approximations of the phase function, the direction and polarization state of the photons after a scattering event are determined by the Muller matrix elements. Thus, results of the SKIRT simulations are not subject to the uncertainties mentioned earlier for the Draine 2003 mixtures.
We assumed a geometry in which the scattering medium corresponds to a bi-conical polar outflow wind of half-opening angle ψCone and dust is present in the outer 10 deg of the cone, on top of an accretion disk surrounded by an optically thick dust torus of half-opening angle ψTorus. The torus and the polar outflow cones have the same polar axis. The emission of the accretion disk is given by the model of Stalevski et al. 2016, and the outflow cone starts at its sublimation radius. The left-most panel of Fig. 8 in Stalevski et al. 2023 shows the general aspects of the geometry we assumed here (although we assumed a proper cone instead of a hyperboloid). We did not consider a broad line region (BLR) as the RSpecial broadband photometry is dominated by the continuum, with only a relatively weak C III] broad emission line contributing in its wavelength range (see Assef et al. 2020). Note that the dust particles in the outflow cone are not moving with respect to the accretion disk in our model, but that this does not have an impact on our results due to the lack of a BLR. Zakamska & Alexandroff 2023 have shown that this motion could have an impact on the specific polarization properties of the BLR, but not of the accretion disk continuum. We find that the dust optical depth in the explored range does not strongly affect the polarization fraction estimate but has a considerable impact on the fraction of light scattered into the line of sight. For an optical depth of τ = 0.1 at rest frame 5500 Å (i.e., the V band), measured for a line of sight from the central engine through the dusty region of the polar outflow cone, an average of order 1% of the light is scattered, resembling the 1.3% determined by our SED modeling. We hence fixed the optical depth to τ = 0.1 for all simulations.
We used this geometry to test a number of dust mixtures with different grain size distributions and chemical compositions in the cone. We started with the standard Galactic ISM power-law size distribution ∝a−3.5 from Mathis et al. (1977, hereafter MRN77) with a dust grain size range of a = 0.005 − 0.25 μm. We first considered a combination of silicates and graphites in a 51/49 ratio, as given by the normalization of the grain size distributions in Weingartner & Draine 2001. We refer to this dust mixture as MRN77gra+sil. However, it has recently been suggested that dust in the polar regions of AGNs, tentatively associated with dusty winds, is instead dominated by large graphite grains given that it likely originates in the sublimation zone, where small grains and silicate grains are destroyed (see Stalevski et al. 2017; Hönig 2019, and references therein). Furthermore, a deficit of silicates is a qualitatively reasonable expectation for the dusty regions of a quasar outflow, as shocks significantly raise the gas temperatures and graphites sublimate at a higher temperature (∼1800 K) than silicates (∼1200 K). Considering this, we also tested a graphite-only dust mixture with, otherwise, the same parameters. We refer to this mixture as MRN77gra. We also experimented with varying the power-law exponent of the dust distribution in the range of 0 to −3.5 with a step of −0.5 and changing the range of grain sizes to larger values of 0.1 − 1 μm as well as 1 − 10 μm. Finally, we tested the Draine 2003 mixtures for SMC, LMC and Milky Way for completeness, as well as that proposed by Gaskell et al. 2004. The Draine 2003 mixtures have a very similar slope to that of MRN77, but with an extended grain size range and a smooth high-end cutoff. The dust distribution of Gaskell et al. 2004 has a flatter grain size distribution dominated by larger grains as compared to that of MRN77.
The optical properties of the dust grains and elements of the scattering matrix are calculated based on the dielectric function given by Laor & Draine 1993 and Li & Draine 2001. For simplicity and optimization of the simulations, the dust is distributed smoothly. We note that Marin et al. 2015 found that fragmentation of the scattering media does not strongly affect the polarization fractions produced by scattering in the polar regions of type 2 AGNs, and that uniform dust distributions provide a good approximation in these cases. For the torus composition, we assumed in all cases an optically thick flared disk geometry with a 51/49 silicate-to-graphite ratio and an equatorial optical depth of 10 mag at 9.7 μm. The specific details of the torus composition do not significantly affect the results of the simulations.
All simulations are run for rest-frame wavelengths in the range of 1200−3000 Å in steps of 150 Å, with additional points close to the effective wavelengths of the UBVRI bands for comparison with polarization properties of AGNs at low redshifts. Each simulation returns all four Stokes parameters, but the axis of the system is always selected to make the spatially integrated U = 0. Since we are only dealing with dust scattering, there is no circular polarization, and hence V = 0 by definition. For each simulation, we took the spatially integrated Q and I and convolved them spectrally with the RSpecial broadband filter curve (shifted to z = 2.099). Given the large degeneracies between parameters, we first ran simulations with a fixed set of fiducial values of ψTor = 50 deg and ψCone = 30 deg, varying the inclination angle η between 55 and 85 deg in steps of 10 deg to test if we can find polarization fractions that approach the observed value. We find the optimal inclination to match the observations by interpolating within the grid of η values. All the dust mixtures that have a graphite-only composition can explain the observed polarization fraction in W0204–0506 regardless of the specific grain size distributions (i.e., both in range and power-law index). Therefore, for the sake of simplicity, when considering graphite-only models in the following, we only consider the standard MRN77 size parameters. On the contrary, nearly all the silicate-graphite mixtures fail, with only the model with the largest grain sizes (i.e., a = 0.1 − 1 μm and a = 1 − 10 μm) being able to reproduce the observed polarization fraction. Figure 3 shows the polarization fraction as a function of wavelength for a selection of the silicate/graphite mixtures considered. We focus for the rest of the article on the results for the MRN77gra dust mixture, as it is more physically justified than the model with larger grain sizes. Additionally, we note that in the companion paper that analyzes a larger set of polarization results for BHDs, we find that polarization fractions tend to drop toward shorter wavelengths, consistent with MRN77gra dust but not with the mixture with large grain sizes (Assef et al., in prep.).
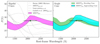 |
Fig. 3. Polarization fraction as a function of wavelength for the different dust models tested with SKIRT assuming the scattering medium consists of a polar outflow. Left panel: Expected polarization fraction for bipolar cones for a number of different dust mixtures. Right panel: Expected values for single approaching or receding cones for the preferred dust mixture. The green circle shows the measurement for W0204–0506 in the RSpecial band. The horizontal error bar shows the width of the photometric band. |
4.3. Detailed outflow polarization model
We refined the grid for the MRN77gra dust mixture to better map the degeneracies between the parameters. Additionally, given that the images in Fig. 2 suggest the outflow is only spreading in one direction, we modified the simulations to consist of only one outflow cone that is either approaching or receding from the observer. This makes the simulations somewhat more realistic, but note that the effects of considering only one cone are fairly small for the total polarization since the cone approaching the observer is more luminous and hence dominates the estimates (see Fig. 3). We computed the simulations in a grid of ψTorus = 25 deg to 60 deg and ψCone = 20 deg to ψTorus. In the upper limit of ψCone = ψTorus, the cone fills in the aperture of the torus, and only the inner parts of the cone are illuminated by the accretion disk. We also considered inclination angles between η = ψTorus and 90 deg. All parameters were sampled in steps of 5 deg and then interpolated. Figure 3 shows the range of models that fit the observed polarization with χ2 ≤ 1. Figure 4 shows the degeneracies between the parameters. For display purposes, the approaching cones are presented as positive inclinations while the receding cones are presented as negative inclinations. We constrain the polar outflow cone geometry to have ψCone ≲ 50 deg and the inclination to be η ≳ 45 deg. Furthermore, there is a tight relation observed between the two: the polarization fraction strongly increases with the inclination angle and decreases for broader outflow cones, setting up a trade-off between them. We unfortunately cannot constrain the torus opening angle with the limited data available.
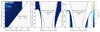 |
Fig. 4. Maps of the minimum χ2 found as a function of the three parameters fit: ψTorus, ψCone, and η. The hatched regions show parameter combinations that were not allowed, either because we would have a direct line of sight to the accretion disk or because the cone would be larger than the torus opening. Approaching (receding) cones are presented as having positive (negative) inclination angles, η. |
We can also visually compare the properties of a representative model with our observations. We assumed an approaching cone with an intermediate inclination of η = 60 deg for this representative model. We also assumed ψCone = 33.5 deg, estimated from the tight relation with η observed in Fig. 4. This polar outflow cone shape is shown by the dashed lines in the top panels of Fig. 2. We have placed the vertex of the cone at the center of the brightest pixel of the F160W image, which is the likely location of the quasar, and have rotated the cone to match the polarization angle found in the extended UV region. The match with the F555W morphology is very good, particularly at the base, providing additional confirmation that the UV emission in W0204–0506 can be explained by light scattered from a polar outflow. The distribution of polarization angles and fractions that would be observed in the RSpecial band for this representative model, as well as that of the fluxes observed by HST are shown in the bottom panels of Fig. 2, convolved with the appropriate instrument PSFs for comparison and applying the same rotation as before. We assumed a torus opening angle of ψCone = 40 deg for these simulated images, although the results are insensitive to this choice (see Fig. 4). As mentioned earlier, the opposite outflow cone is not immediately observed in the F555W image, which may point to it being dustier or modified, and potentially stalled, by the interaction with the ISM, similar to the scenario recently found for the Hot DOG W2246–0526 by Liao et al. (in prep.) using ALMA observations. As mentioned earlier, a different morphology for this opposite outflow could further account for the gradient observed in the polarization fraction and angle in the FORS2 observations.
4.4. Outflow properties
Given the cone geometry and the dust optical depth, we can estimate the mass of the outflow by assuming that all the dust involved in the scattering is part of the outflow and that the outflow has a gas composition of pure hydrogen with a uniform distribution throughout the cone, including the dustless inner regions. We also assumed the median dust-to-gas ratio of Maiolino et al. 2001 for AGNs of E(B − V)/NH = 1.5 × 10⁻²³ cm2 mag with an RV of 3.1, and a cone height of 10 kpc. For each model we computed the average scattered flux fraction and linearly scale τV to match the measured 1.3%. We computed the distribution of the gas mass by adding the values for all models weighted by their likelihood based on the χ2. We find a 95.4% range between 5 × 10⁸ M⊙ and 4 × 10⁹ M⊙. While broad, this gas mass range is consistent with that found for [O III] outflows in Hot DOGs by Finnerty et al. 2020 of ∼106 − 109 M⊙, with a median of ∼2 × 10⁷ M⊙. We further note that a scattered light ray going perpendicularly through the cone at mid-height (i.e., 5 kpc from the base) would suffer an obscuration in the range of E(B − V) = 0.004 mag to 0.04 mag (95.4% confidence), somewhat below the measured value of E(B − V) = 0.1 mag from the SED modeling. Hence, we would not expect the scattered light to be substantially obscured. We note that in reality the gas and dust are more likely to be concentrated at the base of the cone (which is also strongly suggested by the morphology in the F555W image), which could lead to the larger obscuration measured from the SED modeling.
As discussed in Sect. 2.2, the rest-UV spectrum of W0204–0506 shows a bright, relatively narrow He II emission line. This He II line might be produced, at least in part, by the shock-heated gas in the putative outflow. Given the relatively narrow angle of the best-fit cone, if the He II is produced by the outflow we can roughly estimate its intrinsic velocity dispersion by simply correcting for the inclination of the polar outflow cone, η, which we have constrained to exceed ∼45 deg. Doing this we find an intrinsic FWHM ≳870 km s−1. For the reference inclination of 60 deg assumed earlier, the FWHM would be about 1200 km s−1. Finnerty et al. 2020 found observed FWHM values for [O III] outflows in the range of 1500 − 8300 km s−1, suggesting the inclination of the W0204–0506 outflow cone could be larger than ∼65 deg.
We can also use these gas mass and intrinsic velocity width estimates to assess the energetics of this outflow, namely the mass outflow rate (Ṁout), the kinetic power of the outflow (Ėout) and its momentum flux (Ṗout). We used here the same equations used by Finnerty et al. 2020 to study Hot DOG outflows using the [O III] emission line, which depend on the outflow velocity, vout, and its gas mass. Finnerty et al. 2020 estimates vout as  , where σ is the dispersion of the line used to trace the outflow and voffset is its velocity offset. Since we based our redshift measurement for W0204–0506 on the He II emission line (see Sect. 2.2), we were not able to estimate voffset and so can only set a lower limit of vout ≳ 2σHeII/cos η. We find
  ,
,  and
and  with 95.4% confidence. Taking the fiducial case explored earlier with η = 60 deg, ψCone = 33.5 deg and ψTor = 40 deg, we instead find larger values for all these quantities, namely
  ,
,  and
and  . These are consistent with the range probed by the results of Finnerty et al. 2020. Assef et al. 2016 estimated a total IR luminosity for W0204–0506 of LTIR = 4.4 × 10¹³ L⊙. If we assume this corresponds to the total energy produced by the accretion disk of the AGN, we find that
  for our fiducial model, although other valid parameter combinations can result in values that even exceed 100%. The ratio for our fiducial model is somewhat below the typical range of coupling fractions between the AGN luminosity and the outflowing gas that is required by simulations to engage in effective feedback (see, e.g., Hopkins & Elvis 2010; Zubovas & King 2012), although drawing firm conclusions from such comparisons is challenging Harrison & Ramos Almeida 2024, particularly since much of the AGN-ISM energy coupling might not be easily observable Ward et al. 2024.
5. Summary
We have presented VLT/FORS2 imaging polarimetry observations of the BHD W0204–0506, a hyper-luminous ( ), heavily obscured (
 ) quasar at z = 2.0993 ± 0.0003 (see Sect. 2.2). This object was previously identified by Assef et al. 2016, 2020 as likely having its optical/UV emission dominated by scattered light from the heavily obscured central engine. SED modeling shows that the UV/optical emission is described well by a mildly obscured (
 ) quasar with about 1.3% of the luminosity of the heavily obscured component (see Sect. 2.2). From our observations we find a spatially integrated linear polarization fraction of p = 24.7 ± 0.7% in the RSpecial band (rest frame of ∼2100 Å), confirming the scattered light nature of its UV emission.
The BHD is spatially resolved by our imaging polarimetry observations, and we find a gradient in p from about 20–30% toward the northwest. By comparing these polarimetry observations with HST/WFC3 observations of the source, we find that the scattered light emission morphology closely matches that of the UV emission in the F555W band (rest frame of ∼1800 Å), and that p increases with distance from the peak of the F160W emission (∼5200 Å), which we assume to be the position of the quasar. Given the large polarization fraction, we argue that the totality of the F555W emission must come from scattered light, as SF is unpolarized, and that the scattering medium must correspond to a massive gaseous outflow away from the line of sight, with a projected extension on the order of 10 kpc.
We argue that, given the large size of the outflow, the scattering must be dominated by dust particles. We used simulations done with the radiative transfer code SKIRT to compare the scattering produced by different dust mixtures, assuming that the scattering dust is distributed in polar cones starting at the sublimation radius of the quasar. We conclude that the results are best explained if the scattering is done by graphite-rich dust with the size distribution of Mathis et al. 1977, a mixture we refer to as MRN77gra. Silicate-rich distributions, such as those from Draine 2003 and Gaskell et al. 2004, fail to reproduce the observed linear polarization fraction. We argue that this is consistent with the outflow scenario, as the higher sublimation temperature of graphite dust grains compared to silicate ones could naturally result in a graphite-rich dust mixture.
We then explored in greater depth the geometry of the outflow through simulations with the SKIRT code assuming the MRN77gra dust mixture. We find that the observations can be well reproduced for an outflow cone with a half-opening angle of ≲50 deg and an inclination angle of ≳45 deg with respect to the line of sight. We find with 95.4% confidence that the outflow has a total gas mass of between 5 × 10⁸ M⊙ and 4 × 10⁹ M⊙. We used the observed width of the He IIλ1640 Å emission line corrected by the inclination as a lower limit on the outflow velocity and find a mass outflow rate  , kinetic power
  and momentum flux
  . These are likely conservative lower limits based on the lower limit of the outflow velocity. We find that these values are generally consistent with those found using the [O III] emission line for Hot DOGs by Finnerty et al. 2020, and that it is not clear whether the outflow is energetic enough to affect the long-term evolution of the host galaxy.
The case of W0204–0506 highlights that outflow cones in luminous quasars can be narrow enough, and potentially with enough obscuration at the base, to only be clearly detectable from certain lines of sight when looking for broad forbidden emission lines. We may indeed be missing a larger fraction of the outflow budget in quasars due to inclination effects. The results we have presented here suggest that polarimetric imaging can be a fundamental tool for a comprehensive census of gas outflows in luminous quasars and can be used to investigate their geometries in a way that is not possible with traditional spectroscopic observations. Further multiwavelength and high-spatial-resolution polarimetric imaging observations of W0204–0506, as well as other Hot DOGs and hyper-luminous quasars, will be critical to provide a complete picture of galaxy evolution and AGN feedback under such extreme conditions.
Acknowledgments
RJA was supported by FONDECYT grant number 1231718 and by the ANID BASAL project FB210003. MS acknowledges support by the Ministry of Science, Technological Development and Innovation of the Republic of Serbia (MSTDIRS) through contract no. 451-03-136/2025-03/200002 with the Astronomical Observatory (Belgrade). DJW acknowledges support from the Science and Technology Facilities Council (STFC; grant code ST/Y001060/1). Part of this research was carried out at the Jet Propulsion Laboratory, California Institute of Technology, under a contract with the National Aeronautics and Space Administration (80NM0018D0004). ML was supported by the grants from the Rubin-Chile Fund (DIA3324), the National Natural Science Foundation of China (Nos.11988101, 11973051, 12041302), the China Postdoctoral Science Foundation (No. 2024M753247) and the International Partnership Program of Chinese Academy of Sciences, Program No.114A11KYSB20210010. TDS acknowledges the research project was supported by the Hellenic Foundation for Research and Innovation (HFRI) under the “2nd Call for HFRI Research Projects to support Faculty Members & Researchers” (Project Number: 3382). This research made use of Photutils, an Astropy package for detection and photometry of astronomical sources Bradley et al. 2024.
References
- Abdurro’uf, Accetta, K., Aerts, C., et al. 2022, ApJS, 259, 35 [NASA ADS] [CrossRef] [Google Scholar]
- Alexandroff, R. M., Zakamska, N. L., Barth, A. J., et al. 2018, MNRAS, 479, 4936 [NASA ADS] [CrossRef] [Google Scholar]
- Assef, R. J., Kochanek, C. S., Brodwin, M., et al. 2010, ApJ, 713, 970 [NASA ADS] [CrossRef] [Google Scholar]
- Assef, R. J., Eisenhardt, P. R. M., Stern, D., et al. 2015, ApJ, 804, 27 [Google Scholar]
- Assef, R. J., Walton, D. J., Brightman, M., et al. 2016, ApJ, 819, 111 [Google Scholar]
- Assef, R. J., Brightman, M., Walton, D. J., et al. 2020, ApJ, 897, 112 [NASA ADS] [CrossRef] [Google Scholar]
- Assef, R. J., Bauer, F. E., Blain, A. W., et al. 2022, ApJ, 934, 101 [NASA ADS] [CrossRef] [Google Scholar]
- Baes, M., & Camps, P. 2015, Astron. Comput., 12, 33 [NASA ADS] [CrossRef] [Google Scholar]
- Bischetti, M., Piconcelli, E., Vietri, G., et al. 2017, A&A, 598, A122 [NASA ADS] [CrossRef] [EDP Sciences] [Google Scholar]
- Bradley, L., Sipőcz, B., Robitaille, T., et al. 2024, https://zenodo.org/records/10671725 [Google Scholar]
- Camps, P., & Baes, M. 2015, Astron. Comput., 9, 20 [Google Scholar]
- Camps, P., & Baes, M. 2020, Astron. Comput., 31, 100381 [NASA ADS] [CrossRef] [Google Scholar]
- Cutri, R. M., Wright, E. L., Conrow, T., et al. 2012, Explanatory Supplement to the WISE All-Sky Data Release Products [Google Scholar]
- Decarli, R., Walter, F., Venemans, B. P., et al. 2018, ApJ, 854, 97 [Google Scholar]
- Di Matteo, T., Springel, V., & Hernquist, L. 2005, Nature, 433, 604 [NASA ADS] [CrossRef] [Google Scholar]
- Díaz-Santos, T., Assef, R. J., Blain, A. W., et al. 2016, ApJ, 816, L6 [Google Scholar]
- Díaz-Santos, T., Assef, R. J., Eisenhardt, P. R. M., et al. 2021, A&A, 654, A37 [NASA ADS] [CrossRef] [EDP Sciences] [Google Scholar]
- Draine, B. T. 2003, ApJ, 598, 1017 [NASA ADS] [CrossRef] [Google Scholar]
- Eisenhardt, P. R. M., Wu, J., Tsai, C.-W., et al. 2012, ApJ, 755, 173 [Google Scholar]
- Finnerty, L., Larson, K., Soifer, B. T., et al. 2020, ApJ, 905, 16 [Google Scholar]
- Gaskell, C. M., Goosmann, R. W., Antonucci, R. R. J., & Whysong, D. H. 2004, ApJ, 616, 147 [NASA ADS] [CrossRef] [Google Scholar]
- González-Gaitán, S., Mourão, A. M., Patat, F., et al. 2020, A&A, 634, A70 [NASA ADS] [CrossRef] [EDP Sciences] [Google Scholar]
- Griffith, R. L., Kirkpatrick, J. D., Eisenhardt, P. R. M., et al. 2012, AJ, 144, 148 [NASA ADS] [CrossRef] [Google Scholar]
- Harrison, C. M., & Ramos Almeida, C. 2024, Galaxies, 12, 17 [NASA ADS] [CrossRef] [Google Scholar]
- Harrison, C. M., Alexander, D. M., Mullaney, J. R., et al. 2016, MNRAS, 456, 1195 [Google Scholar]
- Hönig, S. F. 2019, ApJ, 884, 171 [Google Scholar]
- Hopkins, P. F., & Elvis, M. 2010, MNRAS, 401, 7 [NASA ADS] [CrossRef] [Google Scholar]
- Jun, H. D., Assef, R. J., Bauer, F. E., et al. 2020, ApJ, 888, 110 [Google Scholar]
- Laor, A., & Draine, B. T. 1993, ApJ, 402, 441 [NASA ADS] [CrossRef] [Google Scholar]
- Li, A., & Draine, B. T. 2001, ApJ, 554, 778 [Google Scholar]
- Li, G., Assef, R. J., Tsai, C.-W., et al. 2024, ApJ, 971, 40 [NASA ADS] [CrossRef] [Google Scholar]
- Liao, M., Assef, R. J., Tsai, C.-W., et al. 2025, ArXiv e-prints [arXiv:2504.13409] [Google Scholar]
- Maiolino, R., Marconi, A., Salvati, M., et al. 2001, A&A, 365, 28 [NASA ADS] [CrossRef] [EDP Sciences] [Google Scholar]
- Marin, F., Goosmann, R. W., & Gaskell, C. M. 2015, A&A, 577, A66 [NASA ADS] [CrossRef] [EDP Sciences] [Google Scholar]
- Marocco, F., Eisenhardt, P. R. M., Fowler, J. W., et al. 2021, ApJS, 253, 8 [Google Scholar]
- Mathis, J. S., Rumpl, W., & Nordsieck, K. H. 1977, ApJ, 217, 425 [Google Scholar]
- McCully, C., Crawford, S., Kovacs, G., et al. 2018, https://zenodo.org/records/1482019 [Google Scholar]
- McMahon, R. G., Banerji, M., Gonzalez, E., et al. 2021, VizieR On-line Data Catalog: II/367 [Google Scholar]
- Stalevski, M., Ricci, C., Ueda, Y., et al. 2016, MNRAS, 458, 2288 [Google Scholar]
- Stalevski, M., Asmus, D., & Tristram, K. R. W. 2017, MNRAS, 472, 3854 [NASA ADS] [CrossRef] [Google Scholar]
- Stalevski, M., González-Gaitán, S., Savić, Ð., et al. 2023, MNRAS, 519, 3237 [NASA ADS] [CrossRef] [Google Scholar]
- Stepney, M., Banerji, M., Tang, S., et al. 2024, MNRAS, 533, 2948 [CrossRef] [Google Scholar]
- Stern, D., Dey, A., Spinrad, H., et al. 1999, AJ, 117, 1122 [Google Scholar]
- Temple, M. J., Banerji, M., Hewett, P. C., et al. 2019, MNRAS, 487, 2594 [Google Scholar]
- Tsai, C.-W., Eisenhardt, P. R. M., Wu, J., et al. 2015, ApJ, 805, 90 [Google Scholar]
- van Dokkum, P. G. 2001, PASP, 113, 1420 [Google Scholar]
- Vanden Berk, D. E., Richards, G. T., Bauer, A., et al. 2001, AJ, 122, 549 [Google Scholar]
- Vayner, A., Zakamska, N. L., Ishikawa, Y., et al. 2024, ApJ, 960, 126 [NASA ADS] [CrossRef] [Google Scholar]
- Vayner, A., Díaz-Santos, T., Eisenhardt, P. R. M., et al. 2025, ApJ, 989, 230 [Google Scholar]
- Ward, S. R., Costa, T., Harrison, C. M., & Mainieri, V. 2024, MNRAS, 533, 1733 [Google Scholar]
- Weingartner, J. C., & Draine, B. T. 2001, ApJ, 548, 296 [Google Scholar]
- Wu, J., Tsai, C.-W., Sayers, J., et al. 2012, ApJ, 756, 96 [Google Scholar]
- Young, S., Hough, J. H., Axon, D. J., Bailey, J. A., & Ward, M. J. 1995, MNRAS, 272, 513 [NASA ADS] [CrossRef] [Google Scholar]
- Zakamska, N. L., & Alexandroff, R. M. 2023, MNRAS, 525, 2716 [NASA ADS] [CrossRef] [Google Scholar]
- Zakamska, N. L., Hamann, F., Pâris, I., et al. 2016, MNRAS, 459, 3144 [NASA ADS] [CrossRef] [Google Scholar]
- Zubovas, K., & King, A. 2012, ApJ, 745, L34 [Google Scholar]
All Tables
All Figures
|
Fig. 1. SED of W0204–0506. The green circles show the measured flux densities and their 1σ uncertainties in the bands described in the text. The solid black line shows the best-fit SED model composed of a heavily obscured luminous AGN (dashed magenta line), a lightly obscured lower-luminosity AGN that accounts for the scattered light component (solid blue line), and a host galaxy from the Sbc template (dashed green line). The best-fit model has χ2 = 18, but that is mostly driven by the H-band VHS photometry, which is possibly affected by a large equivalent width of the [O III] λ5007+4959 emission line. Removing this band results in a best-fit model with χ2 = 11 with negligible changes to the parameter values. |
| In the text | |
|
Fig. 2. Top-left panels: Resolved maps of the polarization angle and fraction of W0204-0506 measured with FORS2. Polarization values are shown for every pixel where the combined flux from all PSF-matched o- and e-beam images is detected above 5σ. Top-right panels: HST/WFC3 images in the F555W and F160W bands. All cutouts have a size of 3″ × 3″ and have been astrometrically aligned using stars within the field of view. The cross shows the position of the brightest F160W pixel in all panels. The dashed cyan-black lines in all top panels mark the edges of a cone with ψCone = 40 deg and an axis length of 10 kpc projected by the 60 degree inclination of the model (see Sect. 4 for details). Bottom: Representative best-fit model intensity and polarization maps, convolved with the FORS2, F555W, or F160W PSF as appropriate. The cross shows the position of the quasar. |
| In the text | |
|
Fig. 3. Polarization fraction as a function of wavelength for the different dust models tested with SKIRT assuming the scattering medium consists of a polar outflow. Left panel: Expected polarization fraction for bipolar cones for a number of different dust mixtures. Right panel: Expected values for single approaching or receding cones for the preferred dust mixture. The green circle shows the measurement for W0204–0506 in the RSpecial band. The horizontal error bar shows the width of the photometric band. |
| In the text | |
|
Fig. 4. Maps of the minimum χ2 found as a function of the three parameters fit: ψTorus, ψCone, and η. The hatched regions show parameter combinations that were not allowed, either because we would have a direct line of sight to the accretion disk or because the cone would be larger than the torus opening. Approaching (receding) cones are presented as having positive (negative) inclination angles, η. |
| In the text | |
Current usage metrics show cumulative count of Article Views (full-text article views including HTML views, PDF and ePub downloads, according to the available data) and Abstracts Views on Vision4Press platform.
Data correspond to usage on the plateform after 2015. The current usage metrics is available 48-96 hours after online publication and is updated daily on week days.
Initial download of the metrics may take a while.