Open Access
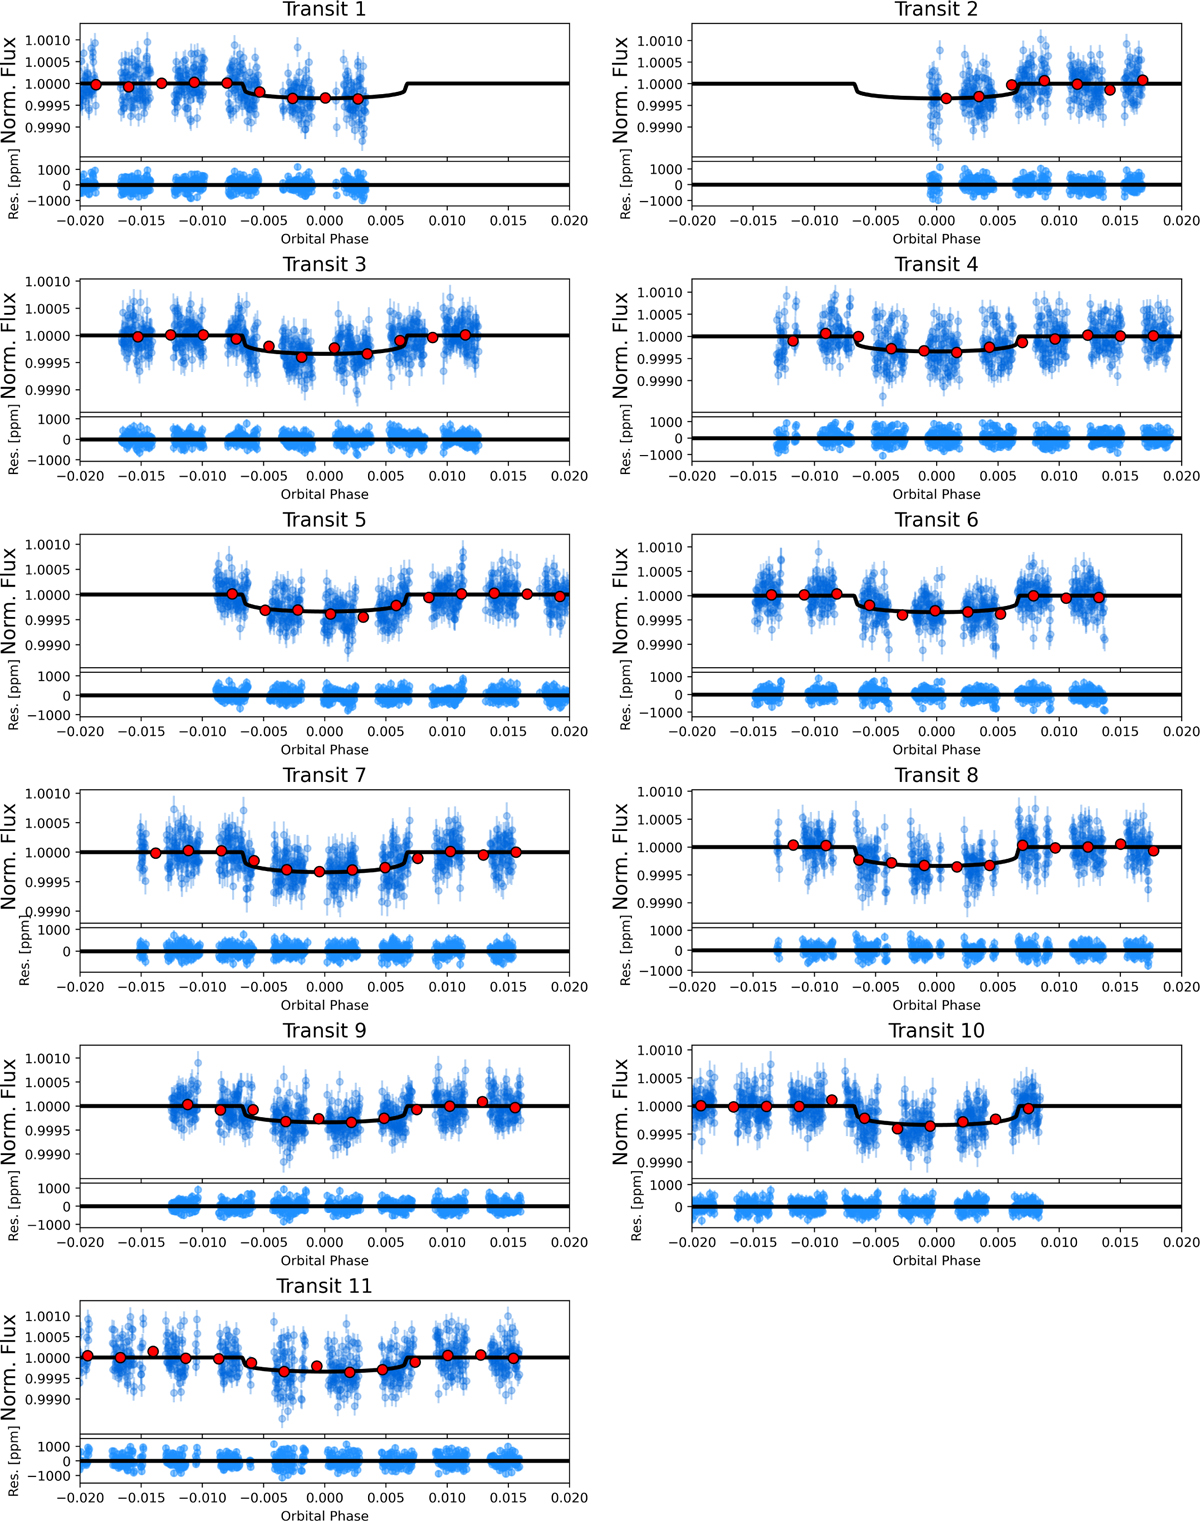
Fig. A.4
Download original image
Individual CHEOPS phase-folded transit light curves of HIP 41378 b. The binned points are showed in red. The oversampled best-fit transit models are overlaid on the light curves.
Current usage metrics show cumulative count of Article Views (full-text article views including HTML views, PDF and ePub downloads, according to the available data) and Abstracts Views on Vision4Press platform.
Data correspond to usage on the plateform after 2015. The current usage metrics is available 48-96 hours after online publication and is updated daily on week days.
Initial download of the metrics may take a while.