Fig. 1.
Download original image
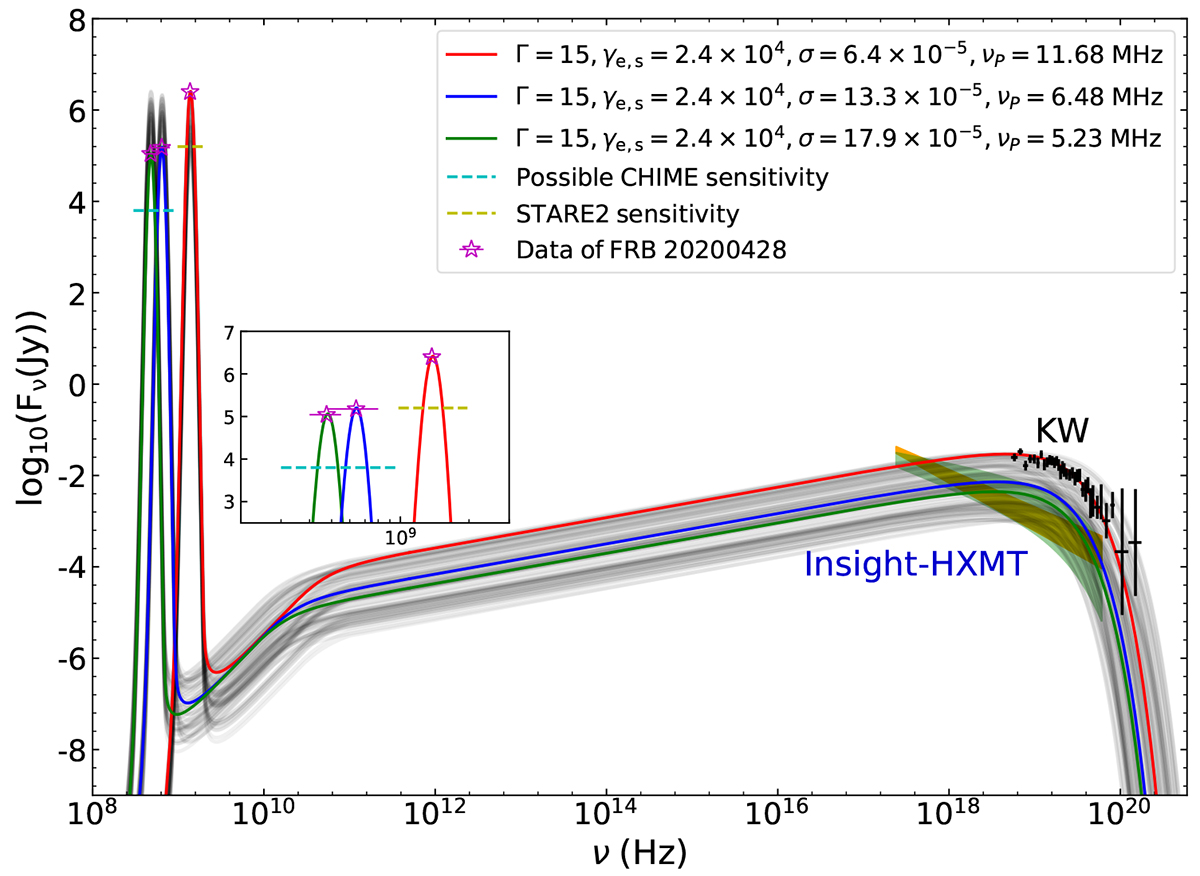
Observed peak frequencies and corresponding peak flux densities of FRB 20200428 (stars) and the spectra of potentially associated X-ray bursts from SGR 1935+2154 observed with Insight-HXMT (green and orange bow ties) and KW (black data points) together with our model analysis results. The gray lines represent the model-predicted spectra of both FRB and associated X-ray bursts derived from 100 randomly selected model parameter sets based on our Monte Carlosimulation analysis and assuming ![]() . The red, blue, and green lines represent the model fit to the observed spectra of three outbursts of FRB 20200428 together with potentially associated X-ray bursts from SGR 1935+2154.
. The red, blue, and green lines represent the model fit to the observed spectra of three outbursts of FRB 20200428 together with potentially associated X-ray bursts from SGR 1935+2154.
Current usage metrics show cumulative count of Article Views (full-text article views including HTML views, PDF and ePub downloads, according to the available data) and Abstracts Views on Vision4Press platform.
Data correspond to usage on the plateform after 2015. The current usage metrics is available 48-96 hours after online publication and is updated daily on week days.
Initial download of the metrics may take a while.