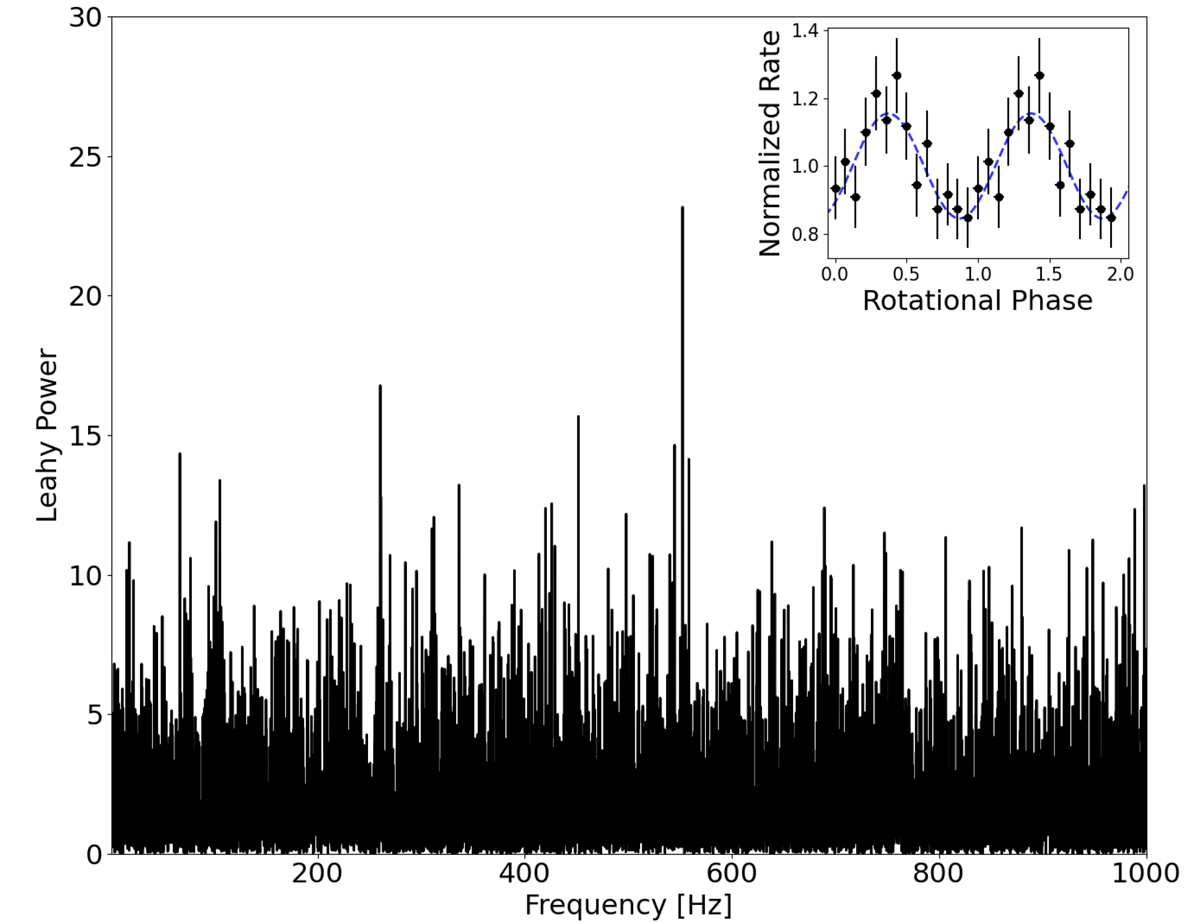
Fig. 2.
Download original image
Fourier PDS from the FUV (120−160 nm) light curve collected with STIS on board HST during an 8-s observation chunk in the interval of (5−13) s since Tref = 52689.0772718 MJD during the rise of the Type I burst. The light curve was re-binned to 250 μs, yielding a Nyquist frequency of 2 kHz. The strong peak is at a frequency of ∼552.392 Hz. In the inset plot, we show the normalized pulse profile obtained by folding the light curve in the same time interval adopted to extract the PDS using 14 phase bins per period cycle. The time series is folded at the frequency of 552.392 Hz. The dashed blue line shows the best-fit decomposition with one harmonic. The background-subtracted pulsed fraction is (16.1 ± 5.4)% at a 1σ confidence level. Two cycles are plotted for clarity.
Current usage metrics show cumulative count of Article Views (full-text article views including HTML views, PDF and ePub downloads, according to the available data) and Abstracts Views on Vision4Press platform.
Data correspond to usage on the plateform after 2015. The current usage metrics is available 48-96 hours after online publication and is updated daily on week days.
Initial download of the metrics may take a while.