| Issue |
A&A
Volume 702, October 2025
|
|
|---|---|---|
| Article Number | A228 | |
| Number of page(s) | 6 | |
| Section | Stellar structure and evolution | |
| DOI | https://doi.org/10.1051/0004-6361/202555270 | |
| Published online | 24 October 2025 | |
An ultraviolet burst oscillation candidate from the low-mass X-ray binary EXO 0748–676
1
ASI – Agenzia Spaziale Italiana, Via del Politecnico snc, 00133 Roma, Italy
2
INAF, Osservatorio Astronomico di Roma, Via Frascati 33, 00078 Monteporzio Catone, RM, Italy
3
INAF, Osservatorio Astronomico di Brera, Via E. Bianchi 46, 23807 Merate, LC, Italy
4
Institute of Space Sciences (ICE, CSIC), Campus UAB, Carrer de Can Magrans s/n, 08193 Barcelona, Spain
5
Institut d’Estudis Espacials de Catalunya (IEEC), 08860 Castelldefels, (Barcelona), Spain
6
Universitá degli Studi di Palermo, Dipartimento di Fisica e Chimica, Via Archirafi 36, 90123 Palermo, Italy
7
INFN, Sezione di Roma 2, Università di Roma Tor Vergata, Via della Ricerca Scientifica 1, 00133 Roma, Italy
8
Department of Electronics Information and Bioengineering, Politecnico di Milano, 20133 Milano, Italy
9
INAF, Osservatorio Astronomico di Capodimonte, Salita Moiariello 16, 80131 Napoli, Italy
10
University of Oxford, Department of Physics, Astrophysics, Denys Wilkinson Building, Keble Road, OX1 3RH Oxford, United Kingdom
⋆ Corresponding author: This email address is being protected from spambots. You need JavaScript enabled to view it.
Received:
23
April
2025
Accepted:
12
September
2025
Abstract
X-ray burst oscillations are quasi-coherent periodic signals at frequencies close to the neutron star spin frequency. They are observed during thermonuclear Type I X-ray bursts from a number of low-mass X-ray binaries (LMXBs) hosting a fast-spinning, weakly magnetic neutron star. Besides measuring the spin frequencies, burst oscillations hold the potential to accurately measure neutron star mass and radius, and thus provide constraints on the equation of state of matter at nuclear densities. Based on far-ultraviolet (FUV) observations of the X-ray binary EXO 0748–676 taken with the Hubble Space Telescope in 2003, we report a possible indication of ultraviolet burst oscillations at the neutron star spin frequency (∼552 Hz), potentially the first such case for an LMXB. The candidate signal is observed during an ∼8 s interval in the rising phase of an FUV burst, which occurred ∼4 s after a Type I X-ray burst. Through simulations, we estimated that the probability of detecting the observed signal power from pure random noise is 3.7%, decreasing to 0.3% if only the burst rise interval is considered, during which X-ray burst oscillations had already been observed in this source. The background-subtracted folded pulse profile of the candidate FUV oscillations in the (120−160 nm) band is nearly sinusoidal with a ∼16% pulsed fraction, corresponding to a pulsed luminosity of ∼8 × 1033 erg s−1. Interpreting the properties of these candidate FUV burst oscillations in the light of current models for optical-ultraviolet emission from neutron star LMXBs faces severe problems. If signals of this kind are confirmed in future observations, they might point to an unknown coherent emission process as the origin of the FUV burst oscillations observed in EXO 0748–676.
Key words: accretion, accretion disks / binaries: eclipsing / stars: low-mass / stars: neutron / pulsars: general
© The Authors 2025
 Open Access article, published by EDP Sciences, under the terms of the Creative Commons Attribution License (https://creativecommons.org/licenses/by/4.0), which permits unrestricted use, distribution, and reproduction in any medium, provided the original work is properly cited.
This article is published in open access under the Subscribe to Open model. This email address is being protected from spambots. You need JavaScript enabled to view it. to support open access publication.
1. Introduction
Most low-mass X-ray binaries (LMXBs) host an old, weakly magnetic (∼108 G) neutron star (NS) which accretes matter from a late-type companion (< 1 M⊙). Neutron stars rapidly rotating on millisecond periods, as the result of spin-up by matter accretion torques over ∼108 − 109 yr-long evolutionary timescales, are believed to be the progenitors of radio millisecond pulsars (MSPs; Alpar et al. 1982). Coherent millisecond X-ray pulsations at the NS spin period have been found during the outbursts of about ∼25 LMXBs (Di Salvo & Sanna 2022). Similar to longer-period, high-magnetic field X-ray pulsars, these pulsations result from funnelled accretion of matter onto the NS magnetic poles and testify to the presence of a magnetosphere. Type I X-ray bursts, a characteristic feature of many NS LMXBs, are bright events with typical durations of tens of seconds, blackbody-like spectra with typical temperatures of ∼1 − 3 keV, and a peak X-ray luminosity of ∼1038 erg s−1, close to or even reaching the Eddington limit of the NS. They are the result of thermonuclear flashes, where newly accreted material on the surface of the NS suddenly burns (see, e.g., Galloway & Keek 2021), with characteristic recurrence times of a few hours. Transient quasi-coherent oscillations in the millisecond range have been observed during Type I X-ray bursts in a number of LMXBs (see, e.g., the review by Bhattacharyya 2022). These ‘burst oscillations’ (hereafter BOs) are linked to the NS rotation as demonstrated by the near coincidence (within ∼1%) between their period and that of the coherent pulsations of magnetospheric origin that are present in the persistent emission of burst sources (Strohmayer et al. 1996; Chakrabarty et al. 2003). The BOs thus provide a tool to measure the NS spin frequency of LMXBs that do not display coherent pulsations.
In the most common interpretation, BOs are generated by a hot spot on the NS surface during a thermonuclear flash, with the observed flux oscillations being produced by the very rapid rotation of the NS through the combined effects of relativistic Doppler-like modulation, beaming, gravitational light deflection, and possibly self-eclipsing (Poutanen & Beloborodov 2006; Morsink et al. 2007). Frequency drifts may result from the hot spot shifting in longitude (and perhaps in latitude), similar to cyclones on Earth (Strohmayer et al. 1997; Spitkovsky et al. 2002; Watts 2012; Chambers & Watts 2020). Spectrally resolved BO observations with a high signal-to-noise ratio using the next generation of very large area X-ray instruments are expected to provide high-precision measurements of NS masses and radii, further constraining the equation of state of matter at supranuclear densities (Watts et al. 2016; Piro et al. 2022; Kini et al. 2024).
The transient NS LMXB EXO 0748–676 was discovered during an outburst in 1985 with the European X-ray Observatory SATellite, EXOSAT (Parmar et al. 1985). The source remained continuously active until August 2008 (Wolff et al. 2008; Hynes & Jones 2008; Torres et al. 2008; Degenaar et al. 2011), when it switched to quiescence. The source again turned into an outburst in June 2024 (Baglio et al. 2024; Knight et al. 2025). Observations while in outburst led to the detection of a number of Type I X-ray bursts (Gottwald et al. 1986; Parmar et al. 1986), many of which were studied with the Rossi X-ray Timing Explorer (RXTE; Bilous & Watts 2019). In February 2003, a Type I burst of EXO 0748–676 was observed simultaneously in the X-ray, far-ultraviolet (FUV), and optical bands (Hynes et al. 2006). The similarity of the light curve profiles in the different bands, together with the ∼4 s delay of the optical/FUV burst relative to the X-ray burst, suggested that the latter drove the burst emission in the lower energy bands. The tail of the burst exhibited a longer decay in the FUV and optical bands than in the X-rays; the rising phase was instead similar across the different energy bands. A very similar phenomenology has been observed also in other NS LMXBs and the optical/UV burst was interpreted in terms of reprocessing of the X-ray burst from the disc and/or the companion star (Grindlay et al. 1978; McClintock et al. 1979; Hackwell et al. 1979; Koyama et al. 1981; Pedersen et al. 1982; Lawrence et al. 1983; Robinson & Young 1997; Hynes et al. 2006; Pearson et al. 2006).
In 2007, X-ray BOs in two bursts of EXO 0748–676 were discovered with RXTE around a frequency of ∼552 Hz corresponding to a NS spin period of ∼1.8 ms (Galloway et al. 2010). The peak-to-peak amplitude was ∼21%, and over the few seconds during which the oscillations were detected, the frequency drifted towards higher values by up to 2 Hz. Searches for coherent pulsations in the persistent X-ray source flux failed to detect a significant signal at the NS spin frequency (Jain & Paul 2011).
EXO 0748–676 also exhibits deep X-ray eclipses and partial optical eclipses every 3.82 h (Crampton et al. 1986; Parmar et al. 1986). The ∼500 s-long X-ray eclipses are sharp and result from the companion star passing in front of the X-ray source (Wolff et al. 2009). They display a residual X-ray flux of ∼7 − 10% of the corresponding mean flux outside eclipse, likely due to photons being scattered along the line of sight by an extended accretion disc corona (Parmar et al. 1986; Bonnet-Bidaud et al. 2001). The system has a high inclination, estimated to be approximately 77° (Knight et al. 2022). Like other LMXBs observed from a high inclination, EXO 0748–676 also shows X-ray flux dips centred around orbital phases of ∼0.6 and ∼0.9, whose profile varies from one orbit to another (Parmar et al. 1986). These dips probably result from X-ray absorption by irregular bulging regions close to the impact point of the accretion stream from the companion star and the outer disc rim (Homan et al. 2003).
In this paper, we discuss a possible candidate for a FUV BO found during a Type I X-ray burst from EXO 0748–676, which may represent the first hint of such a phenomenon in a Type I bursting source. In Sect. 2 we describe the February 2003 Hubble Space Telescope (HST) FUV and RXTE X-ray data that we used and their reduction. Section 3 is devoted to the timing analysis of the burst as observed with both facilities. In Sect. 4 we discuss some interpretations of our results. We draw our conclusions in Sect. 5.
2. Observations
2.1. Hubble Space Telescope
We analysed archival HST observations of EXO 0748–676 acquired on February 18−19, 2003 (proposal ID 9398) with the Space Telescope Imaging Spectrograph (STIS, Prichard et al. 2022). These observations were performed in TIME-TAG mode using the FUV-MAMA detector with 125 μs time resolution. Data were acquired with the G140L grating (115−173 nm) equipped with a 52 × 0.5 arcsec slit (Bohlin et al. 2001). On-source data were collected during six consecutive visits for a total exposure time of about 7.5 h. In the fourth visit, the first and only UV burst in EXO 0748–676 was detected (Hynes et al. 2006). We employed the stis_photons package1 to correct the position of slit channels and assign the correct wavelengths to each time of arrival (ToA). We selected ToAs belonging to channels 993−1007 of the slit to isolate the source signal and minimize the background contribution, and in the 120−160 nm wavelength interval to avoid noisy contribution due to the poor response of the G140L grating at the edge wavelengths. We then applied barycentric correction using the ODELAYTIME task (subroutine available in the IRAF/STSDAS software package) by employing the source co-ordinates RA (J2000) =  , Dec (J2000) =
  (Torres et al. 2008) and the JPL-DE200 ephemeris. We extracted the source energy spectrum during the burst and reduced it with INTTAG and CALSTIS pipeline software, and then corrected for the interstellar extinction assuming E(B − V) = 0.06 (Hynes et al. 2006).
2.2. Rossi X-ray Timing Explorer
We analysed the RXTE observation of EXO 0748–676 that started on February 19, 2003 at 01:47 UT (Obs ID 70047-02-01-11) and was carried out simultaneously with HST observations. We reduced data acquired with the Proportional Counter Array (PCA; 2−40 keV; Jahoda et al. 1996) and 122 μs time resolution. Photon arrival times were corrected to the Solar System barycenter by using the faxbary tool along with the JPL-DE200 ephemeris and the source co-ordinates given above. The 3−20 keV light curve of the X-ray burst is shown in Fig. 1 in black. We extracted the spectrum of the source X-ray emission during the thermonuclear burst. We considered data taken by all layers of the proportional counter units (PCUs) 0−2−3, producing a response matrix with the latest issued calibration. We re-binned the spectrum with the FTOOL grppha in order to have at least 25 counts/bin and added a systematic error of 0.5% to each spectral bin as was suggested by the RXTE calibration team2. The background was subtracted using the Sky_VLE model (pca_bkgd_cmbrightvle_eMv20051128.mdl).
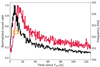 |
Fig. 1. The far-UV burst light curve observed by HST in red and the X-ray burst light curve detected by RXTE in black. The burst count rate is normalized for each instrument at the maximum count rate (312 counts s−1 for HST and 2949 counts s−1 for RXTE). The reference epoch is Tref = 52689.0772718 MJD. The yellow box indicates the time interval of the BO candidate. The box size corresponds to the duration of the time window and the frequency resolution. |
3. Timing analysis
3.1. Burst timing analysis
To search for BOs in the HST burst, we broadly followed the procedure that Bilous & Watts (2019) employed to estimate the significance of BOs in the RXTE dataset. We computed Leahy-normalized power density spectra (PDSs) using overlapping sliding windows of twin = 8 s in length, stepped by 1 s and covering the total burst duration of 127 s. The burst duration was estimated by measuring both the mean (μ) and standard deviation (σ) of the light curve distribution of pre-burst count rates binned at 1 s. The end of the burst was identified as the point in the burst tail where the count rate is just below μ + 2σ. The selected time interval of the burst used for the analysis was 52689.07727–52689.07874 MJD. Since X-ray BOs of EXO 0748–676 were previously detected around 552 Hz and displayed a frequency drift3 of < 2 Hz, we conservatively searched for FUV oscillations over a frequency range of 550 − 555 Hz. Considering the PDS Fourier resolution of 1/twin = 1/8 Hz, Nν = 40 frequency trials were made in each PSD to cover such a frequency range. To identify potential BO candidates, we thus considered signals above a threshold power, Pth, corresponding to a probability of getting pth = 5 × 10⁻⁴ chance candidates per single PSD. Assuming that in the relevant frequency range, variability in the absence of signal can be described by pure Poisson noise, the threshold power would be Pth = 2lnNν + 2ln(1/(1 − C)) = 22.6, where C represents the confidence level, set at 99.95% (Vaughan et al. 1994).
During the final part of the burst rise (marked by the yellow box in Fig. 1), a peak in the PDS was observed exceeding Pth, with a power of 23.17 at a frequency of 552.39(6) Hz. The probability that Poissonian noise produces by chance such a power in the 550 − 555 Hz frequency range is 3.7 × 10⁻⁴. The large overlap between the NPDS = 120 overlapping time intervals considered in our search prevented us from considering them to be statistically independent. To assess the significance of the observed power value and to ensure that rapid variations in the burst light curve did not affect the distribution of noise powers, we relied on simulations based on the procedure described by Bilous & Watts (2019) (see also Bult et al. 2021; Li et al. 2022). We simulated 106 thermonuclear burst light curves drawing photon arrival times from a Poisson distribution. To test that the simulated light curves correctly described the counting noise, we checked that the distribution of 100 × 7920 noise powers4 in the 10−1000 Hz frequency range had an average value of 1.9978(14) at 1σ confidence level, compatible with the expected value from a χ2 distribution with two degrees of freedom. For the real data, the average value (in the same frequency range) was 1.9970(23).
We used the acceptance-rejection method (von Neumann 1951) to generate simulated light curves (LC in the following) with a count rate closely resembling that observed. To associate an average observed count rate, LC(t), with each 1 s bin, we first modelled the LC observed by HST fitting it with a spline. Then, we generated LCmax × Nbins pairs of uniformly distributed random variables (ℓ,τ) in the range [0, LCmax] and [0, Nbin], respectively. Here, LCmax is the maximum observed count rate and Nbins = 127 is the number of 1 s-long bins that cover the considered interval. We then removed from the simulated event list the pairs (ℓ,τ) with ℓ > LC(t). In each of the simulated datasets, we repeated the coherent search strategy in the 550−555 Hz frequency range, obtaining p = 3.7 × 10⁻² of the times a signal with a power equal to or higher than5Pmax. We consider such a value a robust estimate of the probability that a signal with a power equal to or higher than the maximum observed is produced by noise. A similar signal is expected to appear by chance once in every ∼27 FUV bursts observed, and to our knowledge this is the first UV thermonuclear burst and only ever detected by STIS-HST. In addition, the false alarm rate would be reduced to 3 × 10⁻³ if we restricted our search to the burst rise only, i.e. the stage where X-ray BOs have only been detected from EXO 0748–676. However, given the low significance, the signal observed in the power spectrum could be a statistical fluctuation. Future observations of this or other sources in the UV and/or optical bands may confirm or rule out the presence of BOs at energies lower than the X-ray band.
The STIS background count rate was estimated by selecting photons in the slit channels 400−900 and 1100−1800 to avoid the source contribution, within the same time interval as the BO candidate. We then normalized the average count rate to the total number of source slit channels (15). The total count rate (source plus background) was 195 ± 14 counts s−1, with an estimated background contribution of approximately 3% (BKGHST = 5 ± 2 counts s−1, normalized to 15 slit channels). The background-subtracted pulsed fraction (the semi-amplitude of the modulation divided by the average source count rate) of the FUV oscillations we tentatively identified during the burst rise is ∼16% (see inset plot in Fig. 2). The FUV average pulse profile in the 120−160 nm band has an almost sinusoidal shape (see inset plot in Fig. 2) similar to that reported in the X-ray band (Galloway et al. 2010).
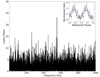 |
Fig. 2. Fourier PDS from the FUV (120−160 nm) light curve collected with STIS on board HST during an 8-s observation chunk in the interval of (5−13) s since Tref = 52689.0772718 MJD during the rise of the Type I burst. The light curve was re-binned to 250 μs, yielding a Nyquist frequency of 2 kHz. The strong peak is at a frequency of ∼552.392 Hz. In the inset plot, we show the normalized pulse profile obtained by folding the light curve in the same time interval adopted to extract the PDS using 14 phase bins per period cycle. The time series is folded at the frequency of 552.392 Hz. The dashed blue line shows the best-fit decomposition with one harmonic. The background-subtracted pulsed fraction is (16.1 ± 5.4)% at a 1σ confidence level. Two cycles are plotted for clarity. |
X-ray BOs were searched for throughout the entire burst observed simultaneously by RXTE, but they were not detected. The upper limit on the pulse amplitude was estimated by computing the PDS using ToAs in the 3−20 keV energy band and in the time interval (5−13) s since Tref = 52689.0772718 MJD and following the procedure reported by Vaughan et al. (1994). We derived a 3σ upper limit of ∼7%. The analysis performed by Galloway et al. (2010) and Bilous & Watts (2019) did not find BOs during this burst, either.
3.2. FUV coherent periodicity search
We also searched for coherent persistent pulsations in EXO 0748–676 using all data in the FUV band acquired with HST-STIS. The total exposure time was 7.5 h, covering about 2 orbits of the binary system. We performed a blind periodicity search in a restricted two-dimensional parameter space starting from the ephemeris reported in Wolff et al. (2009), which was derived from the X-ray orbital eclipses. We demodulated the ToAs by correcting them for the orbital Rømer delay in a circular orbit, which is given by ΔRB = xp sin Man, where xp represents the projected semi-major axis of the pulsar orbit and Man denotes the mean anomaly. For a circular orbit, the mean anomaly simplifies to Man ≡ Ωb(t − Tasc), where Ωb ≡ 2π/Porb is the angular velocity, Porb is the orbital period, and Tasc denotes the epoch of passage at the ascending node. We varied Tasc within the range 52689.1335 MJD < Tasc < 52689.1393 MJD with a step size of 10−5 MJD and the projection of the pulsar semi-major axis, xp, within the range 0.05 lt-s < xp < 1 lt-s (light-seconds) with a step of 2.5 × 10⁻³ lt-s. The orbital period was kept fixed at Porb = 0.1593377 d (Wolff et al. 2009). The starting value of Tasc was estimated by subtracting Porb/4 from the X-ray mid-eclipse epoch measured in the simultaneous RXTE observations. The search interval for the pulsar spin frequency was limited within the frequency range 545 Hz < ν < 565 Hz. We found no evidence of FUV pulsations and put an upper limit on the FUV pulsed sinusoidal amplitude below 1.7% at a 3σ confidence level.
4. Discussion
Our study reveals a candidate detection of FUV BOs at the NS spin period of ∼1.8 ms, observed during an 8 s interval of a thermonuclear burst in the binary MSP EXO 0748–676. We observed the candidate signal during the rise of the FUV emission, marking the first such detection in any Type I bursting source. The candidate signal suggests a pulse amplitude of (16.1 ± 5.4)% in the 120−160 nm FUV band, which is compatible within the uncertainties with the X-ray BO amplitude observed on other occasions from the same source (∼21%, Galloway et al. 2010), as well as similar to other LMXBs (Galloway et al. 2020; Bhattacharyya 2022). For a source distance of ∼7.1 kpc (Galloway et al. 2008a,b), such an amplitude would imply a FUV pulsed luminosity of LFUV, pulsed = 0.16 LFUV ∼ 8 × 1033 erg s−1 in the 120−160 nm band. The FUV burst light curve lagged the X-ray burst light curve by about 4 s (Hynes et al. 2006; Knight et al. 2025), a delay that is consistent with the FUV emission originating from reprocessed X-rays on the surface of the companion star and the outer accretion disc regions. This could suggest that the FUV BOs also originate from the reprocessing of X-ray BOs. However, such an interpretation can be ruled out based on different arguments. Firstly, X-ray BOs were not detected in the burst, with a 7% upper limit on the pulse amplitude. More crucially, reprocessing should retain coherence over timescales of about half the FUV BOs period (or ∼1 ms) not to be smeared out. For an orbital separation of approximately a few times 1011 cm and a companion star radius of ∼2 × 1010 cm, the time of flight difference of reprocessed FUV photons coming from different regions of the companion’s atmosphere would amount to ∼100 − 200 ms, far too long to maintain coherence. Moreover, typical reprocessing times from X-ray photons to optical-UV photons inside the companion’s magnetosphere are of the order of 0.3 − 1 s (Basko & Sunyaev 1973; Basko et al. 1974; Cominsky et al. 1987). We conclude that FUV BOs cannot be due to reprocessing of X-ray BOs.
The possibility that FUV oscillations originate from blackbody-like emission at the NS surface can be ruled out as well. We compared the spectral energy distribution of the total and candidate pulsed emission in the X-ray and FUV bands. First, we fitted the X-ray spectrum using the bbodyrad model in XSPEC. The blackbody temperature at the peak of the X-ray burst was (2.18 ± 0.03) keV, and the inferred radius of the emitting region was (4.2 ± 0.1) km. Extrapolating this model to the FUV band yields a candidate pulsed flux more than four orders of magnitude lower than the observed value (see Fig. 3). We then applied the NS atmosphere model burstatmos (Suleimanov et al. 2018 and references therein), fixing the hydrogen mass fraction to 1 (pure H atmosphere), the NS mass to 1.4 M⊙, the radius to 10 km, and the distance to 7.1 kpc. In Fig. 3, the magenta line shows the burstatmos6 model fitted to the X-ray spectrum after fixing the hydrogen column density to 7 × 1020 cm−2 (Degenaar et al. 2011), and fitting the ratio grad/g, where grad is the radiative acceleration (as defined in Suleimanov et al. 2012 for non-isotropic Compton scattering) and g is the NS surface gravity. The best-fit value obtained is grad/g = 0.62(1). However, also in this case, the extrapolated model underpredicts the FUV pulsed flux by several orders of magnitude.
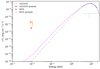 |
Fig. 3. Spectral energy distribution for the total and pulsed emission of EXO 0748–676 corrected for the interstellar extinction. The X-ray spectrum was extracted during the thermonuclear burst in the time interval (5−13) s, since Tref (TDB), while the FUV spectrum was extracted during the first 80 s of the burst. The X-ray spectrum acquired with RXTE in the 3−20 keV energy band is plotted in blue. The X-ray upper limit on pulsed emission is marked by a light blue arrow. The FUV fluxes measured with HST are shown in orange. The FUV pulsed flux with the corresponding error bars is plotted in red. The magenta line represents the fit to the X-ray spectrum using the burstatmos model (Suleimanov et al. 2018), corrected for interstellar extinction and extrapolated down to the FUV band. The dashed green line shows the fit using the bbodyrad model in XSPEC, also corrected for interstellar extinction and extrapolated to the FUV range. The blackbody has a temperature of ∼2.2 keV and an emitting radius of ∼4 km (assuming a source distance of 7.1 kpc; see text). |
Conversely, by solving for the brightness temperature required to emit a luminosity of ∼8 × 1033 erg s−1 from the surface of a NS with a 15 km radius, we derived a value of ∼1011 K. Of course, the X-ray spectrum of the source is ∼4 orders of magnitude fainter than this temperature would imply. A lower limit on the brightness temperature of ∼108 K, was obtained by considering a spherically emitting region with light crossing time of ∼1 ms.
Brightness temperatures reaching ∼1011 K approach the typical threshold for the onset of coherent emission (Cordes et al. 2004; Melrose 2017), which might suggest that the candidate FUV BOs could arise from an as-yet-unidentified coherent process. Alternatively, they might be produced by beamed synchrotron radiation from heated charged particles near the light cylinder radius. However, if the presence of FUV BOs is confirmed, their origin would remain unexplained within the framework of current emission models.
Ultraviolet millisecond pulsations represent a recently discovered phenomenon in binary MSPs, and their interpretation remains under debate. To date, they have been firmly confirmed in only two systems. The transitional MSP PSR J1023+0038 shows pulsed emission in the 165−310 nm band, with a luminosity of ∼1031 erg s−1 (Miraval Zanon et al. 2022), while the accreting MSP SAX J1808.4–3658 exhibits a pulsed luminosity of ∼1032 erg s−1 in the same band (Ambrosino et al. 2021). These values correspond to brightness temperatures of ∼109 and ∼1010 K, respectively, assuming the UV/optical pulsations originate at the NS surface. In the case of SAX J1808.4–3658, the optical/UV pulses are not generated during thermonuclear bursts. If the presence of UV pulsations in EXO 0748–676 is confirmed, its even higher pulsed luminosity would pose a significant challenge to current emission models.
5. Conclusions
We analysed simultaneous observations of the NS-LMXB EXO 0748–676 during a thermonuclear burst detected in 2003 by HST and RXTE. In our search for BOs in the FUV and X-ray bands, we found a possible indication of a sinusoidal FUV signal at a frequency of ∼552 Hz, potentially the first such detection in this band from any LMXB. Interpreting the properties of this signal within the framework of current models for optical/UV emission from NS-LMXBs is not straightforward and raises important open questions, regarding for example what physical mechanism can produce millisecond pulsations in the UV during thermonuclear bursts, and what conditions are required for such emission to occur. Future investigations will aim to address these questions by carrying out similar searches in this and other systems, and by extending the search to the optical band, including sources with unknown NS spin periods.
Orbital Doppler frequency shifts are negligible compared to the observed drift.
We generated 100 light curves, each covering an 8 s time interval in the burst rise where BOs were detected, and subsequently computed the PSDs with a frequency resolution of 1/8 Hz. This resulted in 7920 frequencies in the 10−1000 Hz range. We did not consider frequencies below 10 Hz to avoid contributions from red noise.
For comparison, if the NPDS spectra were considered independent, the probability of drawing a signal with a power of Pmax would have been 4.5 × 10⁻².
Acknowledgments
We thank the referee for very useful comments and suggestions. This paper is based on observations with the NASA/ESA Hubble Space Telescope, obtained at the Space Telescope Science Institute, which is operated by AURA, Inc., under NASA contract NAS5-26555. FCZ is supported by a Ramón y Cajal fellowship (grant agreement RYC2021-030888-I). FA, GI, AP, LS, and DdM acknowledge financial support from the Italian Space Agency (ASI) and National Institute for Astrophysics (INAF) under agreements ASI-INAF I/037/12/0 and ASI-INAF n.2017-14-H.0, from INAF Research Grant ‘Uncovering the optical beat of the fastest magnetised neutron stars (FANS)’. FA, GI, AP, and LS also acknowledge funding from the Italian Ministry of University and Research (MUR), PRIN 2020 (prot. 2020BRP57Z) ‘Gravitational and Electromagnetic-wave Sources in the Universe with current and next generation detectors (GEMS)’. This work was also partially supported by the program Unidad de Excelencia Maria de Maeztu CEX2020-001058-M. GB acknowledges support from ASI/INFN grant n. 2021-43-HH.0. AP acknowledges support from the Fondazione Cariplo/Cassa Depositi e Prestiti, grant no. 2023-2560. Facilities: ADS, HEASARC, HST, RXTE. Software: HEASoft (v6.31), IRAF (v2.16), python3 (v3.10.8), stis_photons.
References
- Alpar, M. A., Cheng, A. F., Ruderman, M. A., & Shaham, J. 1982, Nature, 300, 728 [NASA ADS] [CrossRef] [Google Scholar]
- Ambrosino, F., Miraval Zanon, A., Papitto, A., et al. 2021, Nat. Astron., 5, 552 [NASA ADS] [CrossRef] [Google Scholar]
- Baglio, M. C., Russell, D. M., Alabarta, K., et al. 2024, ATel, 16646, 1 [Google Scholar]
- Basko, M. M., & Sunyaev, R. A. 1973, Ap&SS, 23, 117 [Google Scholar]
- Basko, M. M., Sunyaev, R. A., & Titarchuk, L. G. 1974, A&A, 31, 249 [NASA ADS] [Google Scholar]
- Bhattacharyya, S. 2022, Astrophys. Space Sci. Lib., 465, 125 [Google Scholar]
- Bilous, A. V., & Watts, A. L. 2019, ApJS, 245, 19 [NASA ADS] [CrossRef] [Google Scholar]
- Bohlin, R. C., Dickinson, M. E., & Calzetti, D. 2001, AJ, 122, 2118 [NASA ADS] [CrossRef] [Google Scholar]
- Bonnet-Bidaud, J. M., Haberl, F., Ferrando, P., Bennie, P. J., & Kendziorra, E. 2001, A&A, 365, L282 [NASA ADS] [CrossRef] [EDP Sciences] [Google Scholar]
- Bult, P., Altamirano, D., Arzoumanian, Z., et al. 2021, ApJ, 907, 79 [NASA ADS] [CrossRef] [Google Scholar]
- Chakrabarty, D., Morgan, E. H., Muno, M. P., et al. 2003, Nature, 424, 42 [CrossRef] [PubMed] [Google Scholar]
- Chambers, F. R. N., & Watts, A. L. 2020, MNRAS, 491, 6032 [Google Scholar]
- Cominsky, L. R., London, R. A., & Klein, R. I. 1987, ApJ, 315, 162 [Google Scholar]
- Cordes, J. M., Lazio, T. J. W., & McLaughlin, M. A. 2004, New Astron. Rev., 48, 1459 [Google Scholar]
- Crampton, D., Cowley, A. P., Stauffer, J., Ianna, P., & Hutchings, J. B. 1986, ApJ, 306, 599 [Google Scholar]
- Degenaar, N., Wolff, M. T., Ray, P. S., et al. 2011, MNRAS, 412, 1409 [Google Scholar]
- Di Salvo, T., & Sanna, A. 2022, Astrophys. Space Sci. Lib., 465, 87 [CrossRef] [Google Scholar]
- Galloway, D. K., & Keek, L. 2021, Astrophys. Space Sci. Lib., 461, 209 [NASA ADS] [CrossRef] [Google Scholar]
- Galloway, D. K., Özel, F., & Psaltis, D. 2008a, MNRAS, 387, 268 [Google Scholar]
- Galloway, D. K., Muno, M. P., Hartman, J. M., Psaltis, D., & Chakrabarty, D. 2008b, ApJS, 179, 360 [NASA ADS] [CrossRef] [Google Scholar]
- Galloway, D. K., Lin, J., Chakrabarty, D., & Hartman, J. M. 2010, ApJ, 711, L148 [Google Scholar]
- Galloway, D. K., in’t Zand, J., Chenevez, J., et al. 2020, ApJS, 249, 32 [NASA ADS] [CrossRef] [Google Scholar]
- Gottwald, M., Haberl, F., Parmar, A. N., & White, N. E. 1986, ApJ, 308, 213 [Google Scholar]
- Grindlay, J. E., McClintock, J. E., Canizares, C. R., et al. 1978, Nature, 274, 567 [Google Scholar]
- Hackwell, J. A., Grasdalen, G. L., Gehrz, R. D., et al. 1979, ApJ, 233, L115 [Google Scholar]
- Homan, J., Wijnands, R., & van den Berg, M. 2003, A&A, 412, 799 [NASA ADS] [CrossRef] [EDP Sciences] [Google Scholar]
- Hynes, R., & Jones, E. 2008, ATel, 1816, 1 [Google Scholar]
- Hynes, R. I., Horne, K., O’Brien, K., et al. 2006, ApJ, 648, 1156 [Google Scholar]
- Jahoda, K., Swank, J. H., Giles, A. B., et al. 1996, SPIE Conf. Ser., 2808, 59 [NASA ADS] [Google Scholar]
- Jain, C., & Paul, B. 2011, RAA, 11, 577 [Google Scholar]
- Kini, Y., Salmi, T., Vinciguerra, S., et al. 2024, MNRAS, 535, 1507 [Google Scholar]
- Knight, A. H., Ingram, A., Middleton, M., & Drake, J. 2022, MNRAS, 510, 4736 [Google Scholar]
- Knight, A. H., Rhodes, L., Buisson, D. J. K., et al. 2025, MNRAS, 536, L26 [Google Scholar]
- Koyama, K., Inoue, H., Makishima, K., et al. 1981, ApJ, 247, L27 [Google Scholar]
- Lawrence, A., Cominsky, L., Engelke, C., et al. 1983, ApJ, 271, 793 [Google Scholar]
- Li, Z., Yu, W., Lu, Y., Pan, Y., & Falanga, M. 2022, ApJ, 935, 123 [NASA ADS] [CrossRef] [Google Scholar]
- McClintock, J. E., Canizares, C. R., Cominsky, L., et al. 1979, Nature, 279, 47 [Google Scholar]
- Melrose, D. B. 2017, Rev. Mod. Plasma Phys., 1, 5 [Google Scholar]
- Miraval Zanon, A., Ambrosino, F., Coti Zelati, F., et al. 2022, A&A, 660, A63 [NASA ADS] [CrossRef] [EDP Sciences] [Google Scholar]
- Morsink, S. M., Leahy, D. A., Cadeau, C., & Braga, J. 2007, ApJ, 663, 1244 [NASA ADS] [CrossRef] [Google Scholar]
- Parmar, A. N., White, N. E., Giommi, P., et al. 1985, IAU Circ., 4039, 1 [Google Scholar]
- Parmar, A. N., White, N. E., Giommi, P., & Gottwald, M. 1986, ApJ, 308, 199 [NASA ADS] [CrossRef] [Google Scholar]
- Pearson, K. J., Hynes, R. I., Steeghs, D., et al. 2006, ApJ, 648, 1169 [Google Scholar]
- Pedersen, H., Lub, J., Inoue, H., et al. 1982, ApJ, 263, 325 [Google Scholar]
- Piro, L., Ahlers, M., Coleiro, A., et al. 2022, Exp. Astron., 54, 23 [NASA ADS] [CrossRef] [Google Scholar]
- Poutanen, J., & Beloborodov, A. M. 2006, MNRAS, 373, 836 [NASA ADS] [CrossRef] [Google Scholar]
- Prichard, L., Welty, D., & Jones, A. 2022, STIS Instrument Handbook for Cycle 30 v. 21 (Baltimore: STScI) [Google Scholar]
- Robinson, E. L., & Young, P. 1997, ApJ, 491, L89 [Google Scholar]
- Spitkovsky, A., Levin, Y., & Ushomirsky, G. 2002, ApJ, 566, 1018 [Google Scholar]
- Strohmayer, T. E., Zhang, W., Swank, J. H., et al. 1996, ApJ, 469, L9 [Google Scholar]
- Strohmayer, T. E., Jahoda, K., Giles, A. B., & Lee, U. 1997, ApJ, 486, 355 [Google Scholar]
- Suleimanov, V., Poutanen, J., & Werner, K. 2012, A&A, 545, A120 [NASA ADS] [CrossRef] [EDP Sciences] [Google Scholar]
- Suleimanov, V. F., Poutanen, J., & Werner, K. 2018, A&A, 619, A114 [NASA ADS] [CrossRef] [EDP Sciences] [Google Scholar]
- Torres, M. A. P., Jonker, P. G., Steeghs, D., & Seth, A. C. 2008, ATel, 1817, 1 [Google Scholar]
- Vaughan, B. A., van der Klis, M., Wood, K. S., et al. 1994, ApJ, 435, 362 [NASA ADS] [CrossRef] [Google Scholar]
- von Neumann, J. L. 1951, Nat. Bureau Standards Appl. Math. Ser., 12, 36 [Google Scholar]
- Watts, A. L. 2012, ARA&A, 50, 609 [Google Scholar]
- Watts, A. L., Andersson, N., Chakrabarty, D., et al. 2016, Rev. Mod. Phys., 88, 021001 [NASA ADS] [CrossRef] [Google Scholar]
- Wolff, M., Ray, P., Wood, K., & Wijnands, R. 2008, ATel, 1812, 1 [NASA ADS] [Google Scholar]
- Wolff, M. T., Ray, P. S., Wood, K. S., & Hertz, P. L. 2009, ApJS, 183, 156 [Google Scholar]
All Figures
|
Fig. 1. The far-UV burst light curve observed by HST in red and the X-ray burst light curve detected by RXTE in black. The burst count rate is normalized for each instrument at the maximum count rate (312 counts s−1 for HST and 2949 counts s−1 for RXTE). The reference epoch is Tref = 52689.0772718 MJD. The yellow box indicates the time interval of the BO candidate. The box size corresponds to the duration of the time window and the frequency resolution. |
| In the text | |
|
Fig. 2. Fourier PDS from the FUV (120−160 nm) light curve collected with STIS on board HST during an 8-s observation chunk in the interval of (5−13) s since Tref = 52689.0772718 MJD during the rise of the Type I burst. The light curve was re-binned to 250 μs, yielding a Nyquist frequency of 2 kHz. The strong peak is at a frequency of ∼552.392 Hz. In the inset plot, we show the normalized pulse profile obtained by folding the light curve in the same time interval adopted to extract the PDS using 14 phase bins per period cycle. The time series is folded at the frequency of 552.392 Hz. The dashed blue line shows the best-fit decomposition with one harmonic. The background-subtracted pulsed fraction is (16.1 ± 5.4)% at a 1σ confidence level. Two cycles are plotted for clarity. |
| In the text | |
|
Fig. 3. Spectral energy distribution for the total and pulsed emission of EXO 0748–676 corrected for the interstellar extinction. The X-ray spectrum was extracted during the thermonuclear burst in the time interval (5−13) s, since Tref (TDB), while the FUV spectrum was extracted during the first 80 s of the burst. The X-ray spectrum acquired with RXTE in the 3−20 keV energy band is plotted in blue. The X-ray upper limit on pulsed emission is marked by a light blue arrow. The FUV fluxes measured with HST are shown in orange. The FUV pulsed flux with the corresponding error bars is plotted in red. The magenta line represents the fit to the X-ray spectrum using the burstatmos model (Suleimanov et al. 2018), corrected for interstellar extinction and extrapolated down to the FUV band. The dashed green line shows the fit using the bbodyrad model in XSPEC, also corrected for interstellar extinction and extrapolated to the FUV range. The blackbody has a temperature of ∼2.2 keV and an emitting radius of ∼4 km (assuming a source distance of 7.1 kpc; see text). |
| In the text | |
Current usage metrics show cumulative count of Article Views (full-text article views including HTML views, PDF and ePub downloads, according to the available data) and Abstracts Views on Vision4Press platform.
Data correspond to usage on the plateform after 2015. The current usage metrics is available 48-96 hours after online publication and is updated daily on week days.
Initial download of the metrics may take a while.