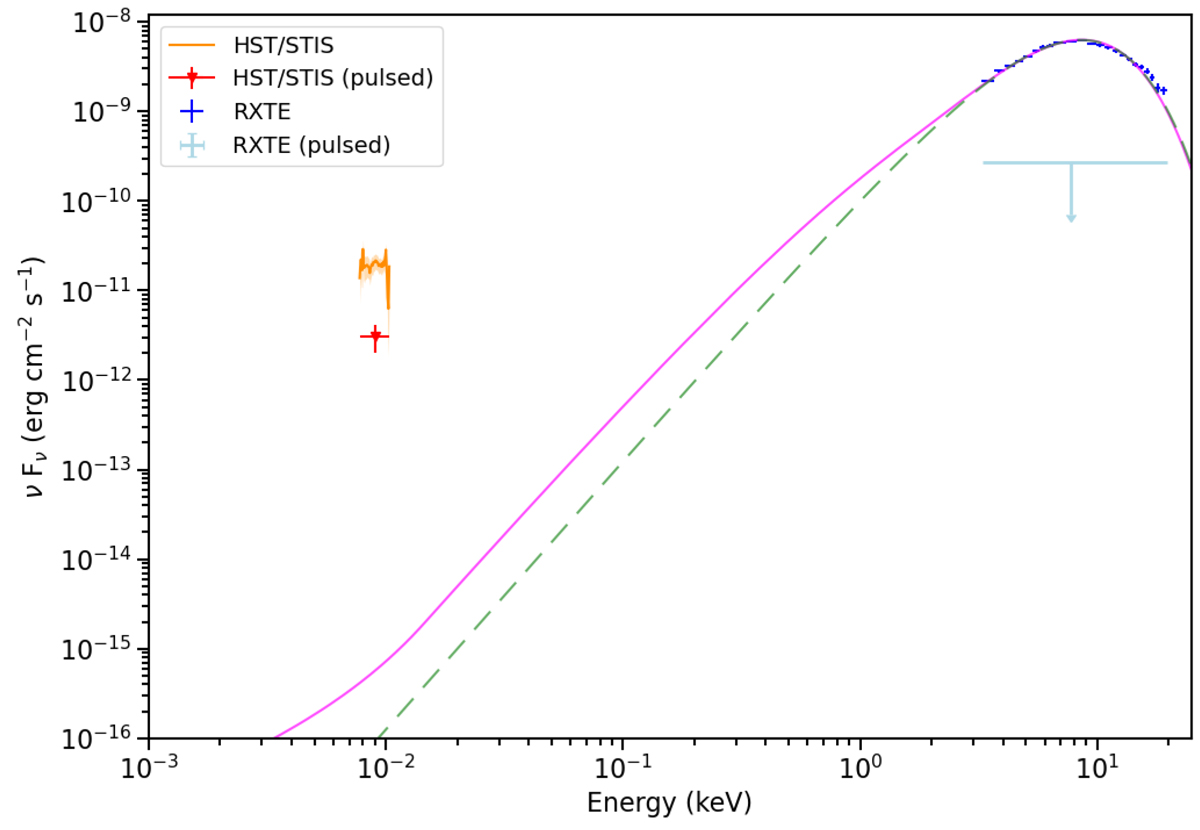
Fig. 3.
Download original image
Spectral energy distribution for the total and pulsed emission of EXO 0748–676 corrected for the interstellar extinction. The X-ray spectrum was extracted during the thermonuclear burst in the time interval (5−13) s, since Tref (TDB), while the FUV spectrum was extracted during the first 80 s of the burst. The X-ray spectrum acquired with RXTE in the 3−20 keV energy band is plotted in blue. The X-ray upper limit on pulsed emission is marked by a light blue arrow. The FUV fluxes measured with HST are shown in orange. The FUV pulsed flux with the corresponding error bars is plotted in red. The magenta line represents the fit to the X-ray spectrum using the burstatmos model (Suleimanov et al. 2018), corrected for interstellar extinction and extrapolated down to the FUV band. The dashed green line shows the fit using the bbodyrad model in XSPEC, also corrected for interstellar extinction and extrapolated to the FUV range. The blackbody has a temperature of ∼2.2 keV and an emitting radius of ∼4 km (assuming a source distance of 7.1 kpc; see text).
Current usage metrics show cumulative count of Article Views (full-text article views including HTML views, PDF and ePub downloads, according to the available data) and Abstracts Views on Vision4Press platform.
Data correspond to usage on the plateform after 2015. The current usage metrics is available 48-96 hours after online publication and is updated daily on week days.
Initial download of the metrics may take a while.