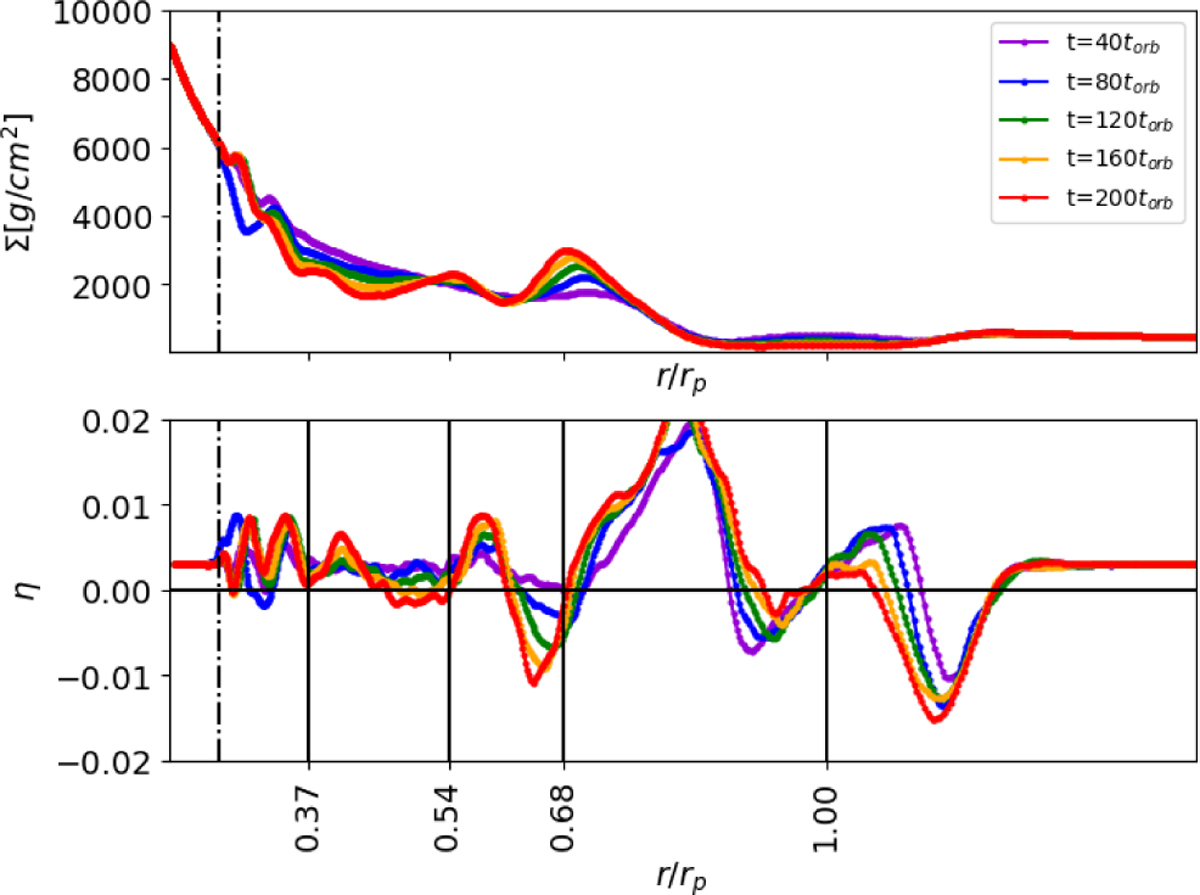
Fig. 2
Download original image
Top panel: azimuthally averaged surface density profile for simulation HDBae. Bottom panel: azimuthally averaged η parameter. The planet is kept on a fixed circular orbit at r/rp = 1 and the ticks on the x axis (as well as the vertical black lines) indicate the values of η ~ 0 with a positive slope. The horizontal black line corresponds to η = 0. The damping region extends radially from rmin/r0 to the dot dashed line.
Current usage metrics show cumulative count of Article Views (full-text article views including HTML views, PDF and ePub downloads, according to the available data) and Abstracts Views on Vision4Press platform.
Data correspond to usage on the plateform after 2015. The current usage metrics is available 48-96 hours after online publication and is updated daily on week days.
Initial download of the metrics may take a while.