Fig. 1.
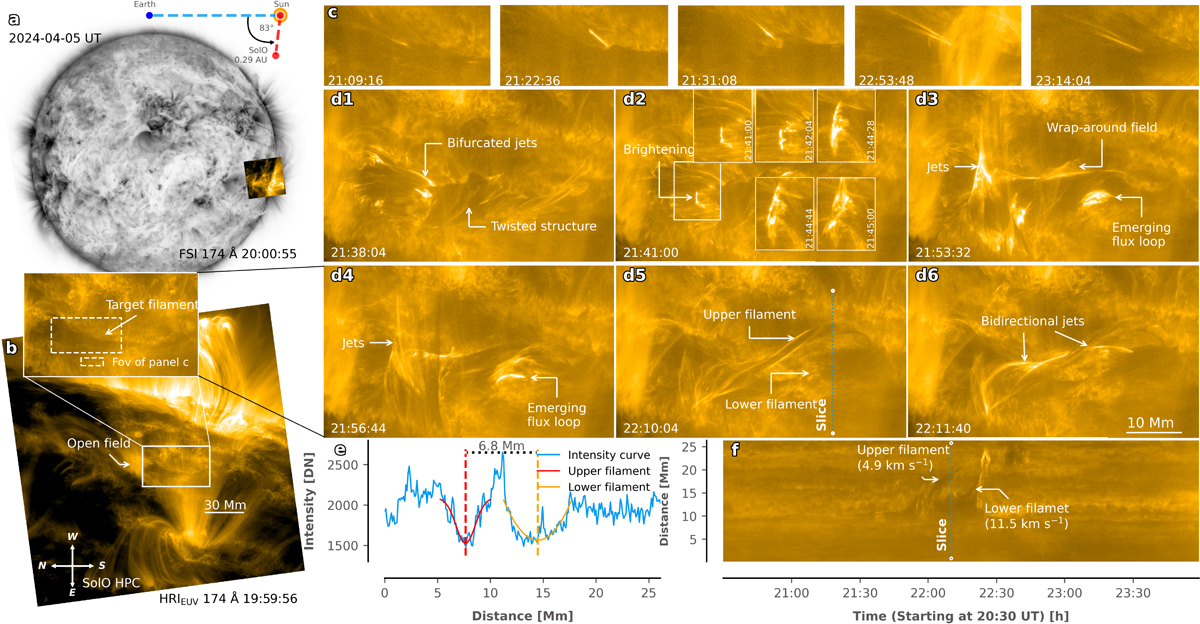
Download original image
(a): Full-disk image of EUI in 174 Å (inverted grayscale) superposed with HRIEUV, with the relative positions of Solar Orbiter. (b): Image of HRIEUV (rotated to facilitate the analysis), with the centrally positioned white box (also the FOV of panel d and its enlargement labeled with the target filament position). (c): Multiple jets throughout the filament eruption. (d1)–(d6): Filament evolution in HRIEUV images. Different features are annotated. The dashed blue line in panel d5 indicates the slice position. (e): Intensity profiles (blue) along the slice; the red and yellow curves fitted with a Gaussian indicate the UF and LF position, respectively, and the double-decker filament centers are indicated with dashed lines. (f): Time-space plot of the filament eruption; the UF and LF eruption speeds are labeled, and the time corresponds to panel d5.
Current usage metrics show cumulative count of Article Views (full-text article views including HTML views, PDF and ePub downloads, according to the available data) and Abstracts Views on Vision4Press platform.
Data correspond to usage on the plateform after 2015. The current usage metrics is available 48-96 hours after online publication and is updated daily on week days.
Initial download of the metrics may take a while.