| Issue |
A&A
Volume 702, October 2025
|
|
|---|---|---|
| Article Number | A88 | |
| Number of page(s) | 8 | |
| Section | The Sun and the Heliosphere | |
| DOI | https://doi.org/10.1051/0004-6361/202555300 | |
| Published online | 08 October 2025 | |
Solar Orbiter reveals persistent magnetic reconnection in medium-scale filament eruptions
1
Leibniz-Institut für Astrophysik Potsdam (AIP), An der Sternwarte 16, 14482 Potsdam, Germany
2
Institut für Physik und Astronomie, Universität Potsdam, Karl-Liebknecht-Straße 24/25, 14476 Potsdam, Germany
3
State Key Laboratory of Solar Activity and Space Weather, School of Aerospace, Harbin Institute of Technology, Shenzhen 518055, China
4
Shenzhen Key Laboratory of Numerical Prediction for Space Storm, Harbin Institute of Technology, Shenzhen 518055, China
5
University College London, Mullard Space Science Laboratory, Holmbury St Mary, Dorking, Surrey RH5 6NT, UK
6
Max-Planck-Institut für Sonnensystemforschung, Justus-von-Liebig-Weg 3, 37077 Göttingen, Germany
⋆ Corresponding author: This email address is being protected from spambots. You need JavaScript enabled to view it.
Received:
25
April
2025
Accepted:
22
August
2025
Abstract
Solar filament eruptions play a key role in driving space weather, yet their fine-scale evolution remains poorly understood due to observational limitations. Using unprecedented high-resolution observations from Solar Orbiter’s Extreme Ultraviolet Imager (105 km/pixel) and Polarimetric and Helioseismic Imager, we detect persistent magnetic reconnection events in a failed filament eruption. We identify magnetic reconnections between the filament and the surrounding magnetic field structures, with a higher frequency and a greater variety of types than previously observed. These reconnections significantly affect the filament stability and eruption dynamics, leading to sequential coronal jets and failed eruptions. We propose a “persistent magnetic cutting” concept, highlighting how persistent small-scale magnetic reconnections cumulatively affect filament stability during its evolution.
Key words: magnetic reconnection / Sun: activity / Sun: filaments / prominences / Sun: flares
© The Authors 2025
 Open Access article, published by EDP Sciences, under the terms of the Creative Commons Attribution License (https://creativecommons.org/licenses/by/4.0), which permits unrestricted use, distribution, and reproduction in any medium, provided the original work is properly cited.
This article is published in open access under the Subscribe to Open model. This email address is being protected from spambots. You need JavaScript enabled to view it. to support open access publication.
1. Introduction
Solar filaments are unique magnetized plasma structures in the solar atmosphere and demonstrate how magnetic fields can confine cold (104 K) dense (1011 − 1012 g cm−3) material (Parenti 2014; Gibson 2018; Chen et al. 2020). Such magnetically dominated plasma confinement states exhibit a rich dynamical behavior, but more importantly, their destabilization can trigger large-scale magnetic energy releases, leading to coronal mass ejections (CMEs) and flares (Chen 2011; Webb & Howard 2012; Warmuth 2015; Shen et al. 2020; Asai et al. 2012). These intense events perturb the solar-terrestrial environment, significantly impacting human space activities and ground-based technological infrastructure (Cliver et al. 2022).
Decades of observations and theoretical and numerical simulation studies have revealed the physical nature of filament eruptions: it is a process of magnetic disruption and energy release. This process occurs through two main mechanisms: one is magnetic reconnection leading to magnetic topology reconfiguration, including tether-cutting reconnection (Moore et al. 2001; Chen et al. 2016, 2018; Xue et al. 2017; Jiang et al. 2021; Shen et al. 2024), breakout reconnection (Antiochos et al. 1999; Shen et al. 2012, 2022; Wyper et al. 2018; Sun et al. 2023), and magnetic flux emergence (Chen & Shibata 2000; Török et al. 2024); the other involves ideal magnetohydrodynamic instabilities, such as kink instability (Ji et al. 2003; Török & Kliem 2005) and torus instability (Kliem & Török 2006; Liu 2008; Shen et al. 2011a; Zhou et al. 2021; Tan et al. 2022; James et al. 2022). These two mechanisms often work together in different ways, resulting in diverse characteristics such as partial or failed filament eruptions (Gilbert et al. 2007). In particular, magnetic reconnection can trigger eruptions, while filaments can suffer failed eruptions due to reconnection with surrounding magnetic fields (Gronkiewicz et al. 2016). Therefore, accurately identifying and evaluating the role of magnetic reconnection through high-resolution observations is crucial for understanding filament evolution.
The European Space Agency’s flagship solar mission Solar Orbiter provides breakthrough opportunities to study these phenomena (Müller et al. 2020). Traditional observations from Earth’s orbit or Lagrange points are limited by a single viewpoint and low spatial resolution, making it difficult to capture fine structures and rapid evolution processes in the solar atmosphere. By approaching the Sun at an unprecedented distance (0.28 AU), Solar Orbiter’s Extreme Ultraviolet Imager (EUI) can observe the solar atmosphere with an ultra-high spatial resolution of 100 km/pixel (Rochus et al. 2020). This far exceeds the Atmospheric Imaging Assembly (435 km/pixel) on the Solar Dynamics Observatory in Earth’s orbit (Lemen et al. 2012). Although the previous sounding rocket experiment Hi-C achieved observations with 75 km/pixel resolution (Cirtain et al. 2013; Kobayashi et al. 2014; Rachmeler et al. 2019; Panesar et al. 2019; Sterling et al. 2020; Patel & Pant 2022), its observing window of only a few minutes made it difficult to capture complete filament eruption processes.
On April 5, 2024, near perihelion, the High Resolution Imager (HRI) at 174 Å (HRIEUV) of EUI observed a limb active region continuously for 4 hours (19:59−23:59 UT, 16-second cadence). Meanwhile, the High Resolution Telescope (HRT) of the Polarimetric and Helioseismic Imager (PHI) obtained eight frames of magnetic field data (20:00−23:30 UT, 30-minute cadence; Solanki et al. 2020), fully covering the filament eruption process. This unique dataset allowed us to study the magnetic reconnection processes in filament evolution with unprecedented resolution.
2. Results
2.1. Multiple jets throughout the eruption
Solar Orbiter provided a unique vantage point at 0.29 AU from the Sun, 83° from the Earth-Sun line on April 5, 2024 (Fig. 1a). HRIEUV’s field of view (FOV) was at the western solar limb, so the target filament (W150S18, about 40 Mm in length) was completely hidden from Earth’s view. Fortunately, HRIEUV’s 4-hour observing window completely covered the filament eruption (21:00−23:00 UT). Figure 1b shows the HRIEUV’s FOV and marks the target filament. In HRIEUV images, the filament was located between several active regions with extended nearby open field to its left.
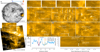 |
Fig. 1. (a): Full-disk image of EUI in 174 Å (inverted grayscale) superposed with HRIEUV, with the relative positions of Solar Orbiter. (b): Image of HRIEUV (rotated to facilitate the analysis), with the centrally positioned white box (also the FOV of panel d and its enlargement labeled with the target filament position). (c): Multiple jets throughout the filament eruption. (d1)–(d6): Filament evolution in HRIEUV images. Different features are annotated. The dashed blue line in panel d5 indicates the slice position. (e): Intensity profiles (blue) along the slice; the red and yellow curves fitted with a Gaussian indicate the UF and LF position, respectively, and the double-decker filament centers are indicated with dashed lines. (f): Time-space plot of the filament eruption; the UF and LF eruption speeds are labeled, and the time corresponds to panel d5. |
Precursor phenomena, such as magnetic cancellation and corresponding brightening, often precede filament eruptions. Multiple jets disturbed the filament (Fig. 1c, not all jets could be shown; see the movie starting at 21:39:08 for other examples), which we considered to be the precursor of this filament eruption. Following one particularly bifurcated jet (Fig. 1d1), the filament exhibited a clearly twisted structure, revealed by hot plasma flows illuminating its fine structure (Li & Zhang 2013; Yang et al. 2014; Shen et al. 2019; Tan et al. 2022, 2023). With the filament activated, we observed a bright loop structure below the filament (Figs. 1d3 and 1d4). The bright loop acts as the signal of an emerging flux loop, and its location is consistent with the location of a multi-jet initiation, suggesting that the reconnection of the emerging flux loop with the filament is the cause of these multiple jets. Based on the HRT line-of-sight (LOS) magnetogram at 20:30 UT, we also detected positive polarity emergence at the same location as the emerging flux loop (Appendix B). The magnetic flux emergence rate was about 2.62 × 10¹⁸ Mx h−1, which is slightly lower than previously reported emerging flux loop events (Zheng et al. 2018; Tan et al. 2022). Given temporal resolution (30-minutes) and the limb projection in this filament, this rate falls within a reasonable range. At the same time (Fig. 1d3), we also identified several field lines wrapped around the filament that will play an essential role in the subsequent filament eruption.
2.2. Reconnection of the filament and open field
Prior to the main eruption, a brightening appeared close to the filament’s left footpoint near the nearby open field (Fig. 1d2). The brightening then began to extend to the sides (up and down) into a bidirectional jet until it evolved into a collimated coronal jet (Fig. 1d2). The observed jet characteristics initially appeared consistent with mini-filament-driven coronal jets (Shen et al. 2011b; Sterling et al. 2015, 2023; Moore et al. 2015; Sterling & Moore 2020; Patel et al. 2024; Shen 2021), where the erupting filament and the open field are reconnected, and the filament material escapes into interplanetary space along the newly formed open field. However, LOS magnetogram showed that the filament’s left footpoint and the nearby open field share the same polarity (Fig. 3a). This suggested that this jet is more similar to previously reported nanojets driven by curved magnetic field lines reconnecting at small angles (Antolin et al. 2021). This also explains why no post-reconnection closed loops were observed in the HRIEUV images, and why this jet was so transient and the filament did not fully reconnect with the open field and evolve into an erupting filament.
2.3. The failed eruption of the upper filament
With these jets temporarily stopped, the filament erupted around 22:00 UT and reached maximum height at about 22:10 UT. Just then, we can clearly observe the existence of a double-layer structure (Fig. 1d5). This is a so-called double-decker filament, where two filaments at different heights share the same polarity inversion line (Liu et al. 2012; Cheng et al. 2014; Zheng et al. 2017, 2019; Tian et al. 2018; Mitra et al. 2020; Chen et al. 2021; Dai et al. 2022; Zhang et al. 2022, 2024; Hou et al. 2023; Karna et al. 2024; Shen et al. 2024). The magnetic field configuration supporting this structure and its possible formation mechanism are analyzed in detail in Appendix A. We analyzed the double-decker filament eruption by placing a slice (the dashed blue line in Fig. 1d5, parallel to the X-axis and spanning across each layer of the double-decker filament, thoroughly capturing the eruption process) along the more pronounced part of the double-layer structure to obtain an eruption time-space plot. We find two intensity minima along the slice, corresponding to the upper and lower filament (UF and LF). The unprecedented spatial resolution attributed to HRIEUV revealed the existence of the UF, which is only 2−3 Mm thick. By fitting Gaussians to these two minima, we obtained a distance between the UF and LF of 6.8 Mm (projected height only, Fig. 1e).
Interestingly, the UF eruption was unsuccessful; instead, another bidirectional jets flowed along the UF appeared during the UF lifting, resulting in the drainage of UF material. We attribute this to the reconnection of the UF with the fields that wrap around the filament, and the bidirectional jet pushed the filament material toward the footpoints (Fig. 1d6, especially clear in the movie). In the time-space plot (Fig. 1f), we see a clear time lag between UF and LF eruption (about 15 min), and the UF projected eruption speed (about 4.9 km s−1) was significantly smaller than that of LF (about 11.5 km s−1). This could be due to the UF eruption weakening the overlying field first, or it could be due to the strong kink instability of LF shown during the LF rotational eruption (see the following section). Notably, considering the filament location (W150S18) and the separation angle (83°), the projected speed measurements underestimate the true value by 11%, assuming a radial eruption trajectory. The whole process is clearly visible in the movie.
2.4. The failed eruption of the lower filament
Bidirectional jets led to UF material drainage, causing the UF to become nearly invisible in HRIEUV images (Fig. 2a). At about 22:15 UT, the LF began to lift. The outer edge of the lifting LF showed a clear brightening and fine features that are indicative of a magnetic flux rope structure. Previous studies suggest that such a brightening is caused by the reconnection of the magnetic flux rope and the overlying field (Xu et al. 2024). We also observed that the left part of the LF brightened significantly more than the right part (Fig. 2c). We argue that this elongated (strip shape) brightening results from the reconnection of the lifting LF with the UF magnetic structure that lost material. The elongated brightening was also consistent with one of the double-decker filament eruption scenarios summarized in previous studies (Karna et al. 2024), namely with an eruption due to a rising lower magnetic flux rope and a merging with higher magnetic flux rope. The LF showed a clearly twisted structure during eruption, further indicating its magnetic flux rope structure. As the LF rotated and lifted further, it interacted with the overlying field (brightening in Fig. 2d), and the LF material fell back along the overlying field. The continuous material fallback also caused brightening at the overlying field footpoints (see the white ellipses in Fig. 2e and movie).
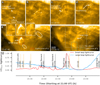 |
Fig. 2. (a)–(d): LF eruption process. The FOV is marked with dashed white boxes in panel f. (e): Small post-flare loop produced by the LF eruption. The loop region is represented by the dashed red box. (f): Large loop visible after the LF eruption. The left footpoint region is represented by the dashed blue box. (g): Normalized light curves corresponding to the dashed red and blue boxes. The moments of the small and large loops are marked, as are moments of multi-jet and filament eruptions. |
After the failed eruption of LF, a small and compact loop appeared above the LF left part, which we consider to be a typical post-flare loop formed by stretching the overlying field during the LF eruption. Besides this small and compact loop, a large loop gradually became visible above the LF right part (Fig. 2f). Previous observational studies have suggested that the overlying loops were filled by chromospheric material that has been heated and evaporated by the accelerated electrons (Netzel et al. 2012). Although we agree with this process, no significant hard X-ray sources were detected by the Spectrometer/Telescope for Imaging X-rays (STIX; Krucker et al. 2020) at the loop apex. Meanwhile, we observed distinct falling filament material along the large loop. Therefore, we suggest that the chromospheric material, heated and evaporated by the falling filament material, likely played a dominant role in the large loop’s appearance. The formation of this large loop can also be understood as resulting from impact-driven magnetic reconnection, where the falling filament material or contracting magnetic structure triggers reconnection with the low-lying field, similar to the mechanism proposed by Wang et al. (2020) for contracting filaments.
We extracted normalized light curves for the small loop and the left footpoint of the large loop by summing over the dashed red and blue box in Fig. 2g, respectively. We find that the brightness of the small loop peaks at least 70 minutes earlier than for the large loop, which also suggests a different production mechanism.
3. Discussion
The unprecedented spatial resolution of HRIEUV enabled us to study the fine structure of a filament and magnetic reconnection processes during its eruption. Meanwhile, the HRT LOS magnetogram further confirmed the magnetic configuration, which we used as the background for a cartoon illustration (Fig. 3).
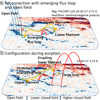 |
Fig. 3. (a): Reconnection process of the double-decker filament, the nearby open field, and the emerging flux loop at the bottom. Orange and green curves represent the UF and LF, and blue the nearby open field. (b): Small post-flare loop formed by the filament lifting stretching the lower closed field and the large loop formed by the falling filament material. The bottom space is divided into three ranges to indicate the magnetic field around the filament. |
The double-decker filament was activated by the emerging flux loop below it, and the left part of the filament was then reconnected with the nearby open field, triggering bidirectionally propagating collimated jets (Fig. 3a). Subsequently, reconnection with the wrap-around field during the UF lifting generated other bidirectional jets, leading to material drainage from the UF (wrap-around field not shown in the cartoon; see Fig. 1d6 and movie). The more extended right part of the LF showed strong twisting and rotation during eruption and reconnected with the higher overlying field on the right side, leading to the fall of the filament material along the overlying field. At the same time, the left part of the LF (including UF) lifting stretches the lower overlying field on the left to form the small classical post-flare loop (Fig. 3b).
Recent studies have suggested that mini-filament eruptions (i.e., on a scale of about 10 Mm), which act as a scaled-down version of large-scale (100−1000 Mm) filament eruptions (Shen et al. 2011b; Sterling et al. 2015, 2023; Sterling & Moore 2020; Patel et al. 2024), are the universal mechanism for triggering solar jets and can explain the solar wind sources (Raouafi et al. 2023; Chitta et al. 2023; Sterling et al. 2024; Farooki et al. 2024). The current filament was of medium scale (40 Mm), which means that it potentially reflects the dynamics of both mini and large-scale filament eruptions. Moreover, it has a double-layer structure and was surrounded by a complex magnetic field configuration, covering a wide range of forms from open to closed field, with the left (right) half of the filament reconnecting with the open (closed) field. We therefore observed the simultaneous generation of coronal jets and failed eruptions from a single filament eruption. Further, due to the double-layer structure of the filament and the inhomogeneity of the closed field, we could also observe both the classical post-flare loop and the larger flare loop above the filament in a single eruption. This suggests that filaments, as common structures in the solar atmosphere, can trigger eruptions on different scales by interacting with the surrounding magnetic field through the universal process of magnetic reconnection. The filament in our study possesses medium-scale, with its eruption encompassing both typical large-scale features and fine structures. This demonstrates the observational feasibility of applying classical magnetic reconnection and magnetohydrodynamic instability analysis to mini-scale filaments, which relies on high-resolution observations from new-generation instruments represented by SolarOrbiter.
Beyond triggering filament eruptions, magnetic reconnection is also a major cause of failed or partial eruptions, occurring either through reconnection between the two filament legs (due to rotation caused by strong kink instability during the eruption; Ji et al. 2003; Török & Kliem 2005; Netzel et al. 2012; Zhou et al. 2019) or through reconnection between the erupting filament and the overlying field (Amari & Luciani 1999; Netzel et al. 2012; Chen et al. 2015, 2023; Gronkiewicz et al. 2016; Yan et al. 2020a,b; Ding et al. 2022; Jiang et al. 2023; Xu et al. 2024; Mrozek et al. 2024; Xue et al. 2024; Liu et al. 2024). In traditional models, reconnection events are typically large-scale and catastrophic, potentially determining a filament’s fate in a single event. By analyzing the entire eruption event and comparing it with traditional eruption models, we discovered a previously unseen, dynamic, and non-monotonic process: the filament continuously undergoes small-scale reconnection events, each modifying its magnetic field and material configuration. We define this process as “persistent magnetic cutting”, which inherits from the traditional tether-cutting reconnection concept but emphasizes the continuous cutting process occurring over an extended period before eruption, characterized by four core characteristics:
-
Persistence: Unlike the catastrophic reconnection occurring at specific stages in traditional theory, small-scale reconnection events persist throughout the filament’s evolution, resulting in a gradual evolutionary pattern.
-
Scale: Individual reconnection events are much smaller than the catastrophic ones in traditional models.
-
Configuration: Unlike traditional theory focusing on reconnection at specific locations, persistent magnetic cutting involves reconnection at multiple sites, interacting with various magnetic field structures (emergent flux loops, open fields, wrap-around fields, etc.), exhibiting more complex spatial distribution features.
-
Accumulation: The accumulative effect of these frequent small-scale reconnection events significantly impacts filament stability, fundamentally different from the single catastrophic reconnection in traditional theory.
Given the complexity of the coronal environment, this persistent process of magnetic reconnection significantly influences eruption success, particularly for small- and medium-scale filaments. This persistent magnetic cutting effect may explain why many small- to medium-scale active region filaments have much shorter lifetimes compared to quiescent ones: the ubiquitous magnetic reconnection in the corona, which is difficult to capture with low-resolution instruments, greatly affects filament stability. Many stable or erupting small- and medium-scale filaments may simply dissipate quietly into the solar atmosphere due to this ubiquitous magnetic reconnection.
4. Conclusions
Using unprecedented high-resolution observations from Solar Orbiter, we identified complex interactions between a double-decker filament and its surrounding magnetic environment. These interactions result in persistent and cumulative effects that differ from the single catastrophic reconnection events in traditional theory (see Appendix B for a further comparison). Our proposed “persistent magnetic cutting” provides a new perspective for understanding filament stability: persistent small-scale reconnection gradually alters a filament’s magnetic topology and material distribution. Although a quantitative analysis of this effect based solely on observations remains challenging, future research that involves advanced numerical simulations will enable deeper investigations of this physical process. This concept bridges the gap between mini-scale filaments (which drive coronal jets) and large-scale filament eruptions (which drive CMEs), demonstrating the dominant role magnetic reconnection plays in filament evolution across different scales.
Data availability
Solar Orbiter data are publicly available through the Solar Orbiter Archive1. This research used the SunPy (The SunPy Community 2020; Mumford et al. 2020) software package to present the observation results. These EUI, PHI and STIX joint observations were part of a Solar Orbiter major flare campaign that included several observing windows in late March and early April 2024 (see Zouganelis et al. 2020; Ryan et al. 2025 for an overview of the campaign). The HRIEUV operated with long-exposure images (cadence of 16 seconds) paired with short-exposure images (cadence of 2 seconds). We used 897 frames of long-exposure images (19:59−23:59 UT) from the HRIEUV level-2 data (Kraaikamp et al. 2023). The cross-correlation technique (see Chitta et al. 2022 for details) was applied to reduce jitter when generating the time-space plots in Fig. 1f. Simultaneously, PHI/HRT obtained eight full polarimetric frames (20:00−23:30 UT) with a 30-minute cadence, providing crucial magnetic field information throughout the eruption. In this work, only the LOS magnetic field was used.
Movie is available at https://www.aanda.org
Acknowledgments
Solar Orbiter is a space mission of international collaboration between ESA and NASA, operated by ESA. The EUI instrument was built by CSL, IAS, MPS, MSSL/UCL, PMOD/WRC, ROB, LCF/IO with funding from the Belgian Federal Science Policy Office (BELPSO); the Centre National d’Etudes Spatiales (CNES); the UK Space Agency (UKSA); the Bundesministerium für Wirtschaft und Energie (BMWi) through the Deutsches Zentrum für Luft- und Raumfahrt (DLR); and the Swiss Space Office (SSO). The German contribution to PHI is funded by the BMWi through DLR and by MPG central funds. The Spanish contribution is funded by AEI/MCIN/10.13039/501100011033/ and European Union “NextGenerationEU/PRTR” (RTI2018-096886-C5, PID2021-125325OB-C5, PCI2022-135009-2, PCI2022-135029-2) and ERDF “A way of making Europe”; “Center of Excellence Severo Ochoa” awards to IAA-CSIC (SEV-2017-0709, CEX2021-001131-S); and a Ramón y Cajal fellowship awarded to DOS. The French contribution is funded by CNES. The STIX instrument is an international collaboration between Switzerland, Poland, France, Czech Republic, Germany, Austria, Ireland, and Italy. The AIP team was supported by the German Space Agency (DLR), grant numbers 50 OT 1904 and 50 OT 2304. Y.S. was supported by the Shenzhen Key Laboratory Launching Project (No. ZDSYS20210702140800001) and the Specialized Research Fund for State Key Laboratory of Solar Activity and Space Weather.
References
- Amari, T., & Luciani, J. F. 1999, ApJ, 515, L81 [NASA ADS] [CrossRef] [Google Scholar]
- Antiochos, S. K., DeVore, C. R., & Klimchuk, J. A. 1999, ApJ, 510, 485 [Google Scholar]
- Antolin, P., Pagano, P., Testa, P., Petralia, A., & Reale, F. 2021, Nat. Astron., 5, 54 [NASA ADS] [CrossRef] [Google Scholar]
- Asai, A., Ishii, T. T., Isobe, H., et al. 2012, ApJ, 745, L18 [NASA ADS] [CrossRef] [Google Scholar]
- Chen, P. F. 2011, Liv. Rev. Sol. Phys., 8, 1 [Google Scholar]
- Chen, P. F., & Shibata, K. 2000, ApJ, 545, 524 [Google Scholar]
- Chen, H., Zhang, J., Ma, S., et al. 2015, ApJ, 808, L24 [Google Scholar]
- Chen, H., Zhang, J., Li, L., & Ma, S. 2016, ApJ, 818, L27 [Google Scholar]
- Chen, H., Duan, Y., Yang, J., Yang, B., & Dai, J. 2018, ApJ, 869, 78 [CrossRef] [Google Scholar]
- Chen, P.-F., Xu, A.-A., & Ding, M.-D. 2020, RAA, 20, 166 [NASA ADS] [Google Scholar]
- Chen, J., Su, Y., Liu, R., et al. 2021, ApJ, 923, 142 [NASA ADS] [CrossRef] [Google Scholar]
- Chen, Y., Cheng, X., Chen, J., Dai, Y., & Ding, M. 2023, ApJ, 959, 67 [Google Scholar]
- Cheng, X., Ding, M. D., Zhang, J., et al. 2014, ApJ, 789, 93 [Google Scholar]
- Chitta, L. P., Peter, H., Parenti, S., et al. 2022, A&A, 667, A166 [NASA ADS] [CrossRef] [EDP Sciences] [Google Scholar]
- Chitta, L. P., Zhukov, A. N., Berghmans, D., et al. 2023, Science, 381, 867 [NASA ADS] [CrossRef] [Google Scholar]
- Cirtain, J. W., Golub, L., Winebarger, A. R., et al. 2013, Nature, 493, 501 [NASA ADS] [CrossRef] [Google Scholar]
- Cliver, E. W., Schrijver, C. J., Shibata, K., & Usoskin, I. G. 2022, Liv. Rev. Sol. Phys., 19, 2 [NASA ADS] [CrossRef] [Google Scholar]
- Dai, J., Li, Z., Wang, Y., et al. 2022, ApJ, 929, 85 [NASA ADS] [CrossRef] [Google Scholar]
- Dasso, S., Nakwacki, M. S., Démoulin, P., & Mandrini, C. H. 2007, Sol. Phys., 244, 115 [Google Scholar]
- Ding, T., Zhang, J., & Hong, J. 2022, ApJ, 933, L38 [NASA ADS] [CrossRef] [Google Scholar]
- Farooki, H., Lee, J., Pecora, F., Wang, H., & Kim, H. 2024, ApJ, 965, L18 [Google Scholar]
- Gibson, S. E. 2018, Liv. Rev. Sol. Phys., 15, 7 [Google Scholar]
- Gibson, S. E., & Fan, Y. 2006, J. Geophys. Res.: Space Phys., 111, A12103 [NASA ADS] [CrossRef] [Google Scholar]
- Gilbert, H. R., Alexander, D., & Liu, R. 2007, Sol. Phys., 245, 287 [NASA ADS] [CrossRef] [Google Scholar]
- Gosling, J. T., & McComas, D. J. 1987, Geophys. Res. Lett., 14, 355 [NASA ADS] [CrossRef] [Google Scholar]
- Gronkiewicz, D., Mrozek, T., Kołomański, S., & Chruślińska, M. 2016, IAU Symp., 320, 221 [Google Scholar]
- Hou, Y., Li, C., Li, T., et al. 2023, ApJ, 959, 69 [NASA ADS] [CrossRef] [Google Scholar]
- James, A. W., Williams, D. R., & O’Kane, J. 2022, A&A, 665, A37 [NASA ADS] [CrossRef] [EDP Sciences] [Google Scholar]
- Ji, H., Wang, H., Schmahl, E. J., Moon, Y. J., & Jiang, Y. 2003, ApJ, 595, L135 [NASA ADS] [CrossRef] [Google Scholar]
- Jiang, C., Feng, X., Liu, R., et al. 2021, Nat. Astron., 5, 1126 [NASA ADS] [CrossRef] [Google Scholar]
- Jiang, C., Duan, A., Zou, P., et al. 2023, MNRAS, 525, 5857 [NASA ADS] [CrossRef] [Google Scholar]
- Karna, N., Dhakal, S., Savcheva, A., Zhang, J., & Kliem, B. 2024, ApJ, 961, 11 [Google Scholar]
- Kliem, B., & Török, T. 2006, Phys. Rev. Lett., 96, 255002 [Google Scholar]
- Kobayashi, K., Cirtain, J., Winebarger, A. R., et al. 2014, Sol. Phys., 289, 4393 [Google Scholar]
- Kraaikamp, E., Gissot, S., Stegen, K., et al. 2023, SolO/EUI Data Release 6.0 2023-01 (Royal Observatory of Belgium (ROB)) [Google Scholar]
- Krucker, S., Hurford, G. J., Grimm, O., et al. 2020, A&A, 642, A15 [NASA ADS] [CrossRef] [EDP Sciences] [Google Scholar]
- Lemen, J. R., Title, A. M., Akin, D. J., et al. 2012, Sol. Phys., 275, 17 [Google Scholar]
- Li, T., & Zhang, J. 2013, ApJ, 770, L25 [NASA ADS] [CrossRef] [Google Scholar]
- Liu, Y. 2008, ApJ, 679, L151 [NASA ADS] [CrossRef] [Google Scholar]
- Liu, R., Kliem, B., Török, T., et al. 2012, ApJ, 756, 59 [Google Scholar]
- Liu, Y., Ruan, G. P., Schmieder, B., et al. 2024, A&A, 687, A130 [NASA ADS] [CrossRef] [EDP Sciences] [Google Scholar]
- Mitra, P. K., Joshi, B., Veronig, A. M., et al. 2020, ApJ, 900, 23 [Google Scholar]
- Moore, R. L., Sterling, A. C., Hudson, H. S., & Lemen, J. R. 2001, ApJ, 552, 833 [Google Scholar]
- Moore, R. L., Sterling, A. C., & Falconer, D. A. 2015, ApJ, 806, 11 [NASA ADS] [CrossRef] [Google Scholar]
- Mrozek, T., Li, Z., Karlický, M., et al. 2024, Sol. Phys., 299, 81 [Google Scholar]
- Müller, D., St. Cyr, O. C., Zouganelis, I., et al. 2020, A&A, 642, A1 [Google Scholar]
- Mumford, S., Freij, N., Christe, S., et al. 2020, J. Open Source Softw., 5, 1832 [NASA ADS] [CrossRef] [Google Scholar]
- Netzel, A., Mrozek, T., Kołomański, S., & Gburek, S. 2012, A&A, 548, A89 [NASA ADS] [CrossRef] [EDP Sciences] [Google Scholar]
- Pal, S., Dash, S., & Nandy, D. 2020, Geophys. Res. Lett., 47, e86372 [Google Scholar]
- Pal, S., Kilpua, E., Good, S., Pomoell, J., & Price, D. J. 2021, A&A, 650, A176 [NASA ADS] [CrossRef] [EDP Sciences] [Google Scholar]
- Panesar, N. K., Sterling, A. C., Moore, R. L., et al. 2019, ApJ, 887, L8 [Google Scholar]
- Parenti, S. 2014, Liv. Rev. Sol. Phys., 11, 1 [Google Scholar]
- Patel, R., & Pant, V. 2022, ApJ, 938, 122 [CrossRef] [Google Scholar]
- Patel, B. D., Joshi, B., Sterling, A. C., & Moore, R. L. 2024, ApJ, 969, 48 [Google Scholar]
- Rachmeler, L. A., Winebarger, A. R., Savage, S. L., et al. 2019, Sol. Phys., 294, 174 [Google Scholar]
- Raouafi, N. E., Stenborg, G., Seaton, D. B., et al. 2023, ApJ, 945, 28 [NASA ADS] [CrossRef] [Google Scholar]
- Rochus, P., Auchère, F., Berghmans, D., et al. 2020, A&A, 642, A8 [NASA ADS] [CrossRef] [EDP Sciences] [Google Scholar]
- Ruffenach, A., Lavraud, B., Farrugia, C. J., et al. 2015, J. Geophys. Res.: Space Phys., 120, 43 [Google Scholar]
- Ryan, D. F., Hayes, L. A., Collier, H., et al. 2025, ArXiv e-prints [arXiv:2505.07472] [Google Scholar]
- Shen, Y. 2021, Proc. Roy. Soc. London Ser. A, 477, 217 [NASA ADS] [Google Scholar]
- Shen, Y.-D., Liu, Y., & Liu, R. 2011a, RAA, 11, 594 [Google Scholar]
- Shen, Y., Liu, Y., Su, J., & Ibrahim, A. 2011b, ApJ, 735, L43 [NASA ADS] [CrossRef] [Google Scholar]
- Shen, Y., Liu, Y., & Su, J. 2012, ApJ, 750, 12 [NASA ADS] [CrossRef] [Google Scholar]
- Shen, Y., Qu, Z., Yuan, D., et al. 2019, ApJ, 883, 104 [Google Scholar]
- Shen, Y., Li, B., Chen, P., Zhou, X., & Liu, Y. 2020, Chin. Sci. Bull., 65, 3909 [NASA ADS] [CrossRef] [Google Scholar]
- Shen, Y., Yao, S., Tang, Z., et al. 2022, A&A, 665, A51 [NASA ADS] [CrossRef] [EDP Sciences] [Google Scholar]
- Shen, Y., Liu, D., Yao, S., et al. 2024, ApJ, 964, 125 [Google Scholar]
- Solanki, S. K., del Toro Iniesta, J. C., Woch, J., et al. 2020, A&A, 642, A11 [NASA ADS] [CrossRef] [EDP Sciences] [Google Scholar]
- Sterling, A. C., & Moore, R. L. 2020, ApJ, 896, L18 [Google Scholar]
- Sterling, A. C., Moore, R. L., Falconer, D. A., & Adams, M. 2015, Nature, 523, 437 [NASA ADS] [CrossRef] [Google Scholar]
- Sterling, A. C., Moore, R. L., Panesar, N. K., et al. 2020, ApJ, 889, 187 [Google Scholar]
- Sterling, A. C., Moore, R. L., Panesar, N. K., et al. 2023, Front. Astron. Space Sci., 10, 49 [Google Scholar]
- Sterling, A. C., Panesar, N. K., & Moore, R. L. 2024, ApJ, 963, 4 [Google Scholar]
- Sun, Z., Li, T., Tian, H., et al. 2023, ApJ, 953, 148 [CrossRef] [Google Scholar]
- Tan, S., Shen, Y., Zhou, X., et al. 2022, MNRAS, 516, L12 [Google Scholar]
- Tan, S., Shen, Y., Zhou, X., et al. 2023, MNRAS, 520, 3080 [CrossRef] [Google Scholar]
- The SunPy Community (Barnes, W. T., et al.) 2020, ApJ, 890, 68 [Google Scholar]
- Tian, Z., Shen, Y., & Liu, Y. 2018, New Astron., 65, 7 [Google Scholar]
- Török, T., & Kliem, B. 2005, ApJ, 630, L97 [Google Scholar]
- Török, T., Linton, M. G., Leake, J. E., et al. 2024, ApJ, 962, 149 [CrossRef] [Google Scholar]
- Wang, Y., Ji, H., Warmuth, A., Li, Y., & Cao, W. 2020, ApJ, 905, 126 [NASA ADS] [CrossRef] [Google Scholar]
- Warmuth, A. 2015, Liv. Rev. Sol. Phys., 12, 3 [Google Scholar]
- Webb, D. F., & Howard, T. A. 2012, Liv. Rev. Sol. Phys., 9, 3 [Google Scholar]
- Wyper, P. F., DeVore, C. R., & Antiochos, S. K. 2018, ApJ, 852, 98 [Google Scholar]
- Xu, Z., Yan, X., Yang, L., et al. 2024, MNRAS, 530, 473 [Google Scholar]
- Xue, Z., Yan, X., Yang, L., Wang, J., & Zhao, L. 2017, ApJ, 840, L23 [CrossRef] [Google Scholar]
- Xue, J.-C., Feng, L., Li, H., et al. 2024, Sol. Phys., 299, 89 [Google Scholar]
- Yan, X., Xue, Z., Cheng, X., et al. 2020a, ApJ, 889, 106 [NASA ADS] [CrossRef] [Google Scholar]
- Yan, X., Li, Q., Chen, G., et al. 2020b, ApJ, 904, 15 [NASA ADS] [CrossRef] [Google Scholar]
- Yang, S., Zhang, J., Liu, Z., & Xiang, Y. 2014, ApJ, 784, L36 [NASA ADS] [CrossRef] [Google Scholar]
- Zhang, Y., Yan, X., Wang, J., et al. 2022, ApJ, 933, 200 [NASA ADS] [CrossRef] [Google Scholar]
- Zhang, X. M., Guo, J. H., Guo, Y., Ding, M. D., & Keppens, R. 2024, ApJ, 961, 145 [NASA ADS] [CrossRef] [Google Scholar]
- Zheng, R., Zhang, Q., Chen, Y., et al. 2017, ApJ, 836, 160 [Google Scholar]
- Zheng, R., Chen, Y., Huang, Z., et al. 2018, ApJ, 861, 108 [NASA ADS] [CrossRef] [Google Scholar]
- Zheng, R., Yang, S., Rao, C., et al. 2019, ApJ, 875, 71 [NASA ADS] [CrossRef] [Google Scholar]
- Zhou, Z., Cheng, X., Zhang, J., et al. 2019, ApJ, 877, L28 [NASA ADS] [CrossRef] [Google Scholar]
- Zhou, C., Shen, Y., Zhou, X., et al. 2021, ApJ, 923, 45 [NASA ADS] [CrossRef] [Google Scholar]
- Zouganelis, I., De Groof, A., Walsh, A. P., et al. 2020, A&A, 642, A3 [NASA ADS] [CrossRef] [EDP Sciences] [Google Scholar]
Appendix A: The magnetic configuration and filament double-layer structure origin
PHI/HRT temporal resolution for vector data can be as short as 1 minute, but, due to telemetry limitations, a 30-minute cadence was used for the Major Flare SOOP (Solar Orbiter Observing Plans). Here, we focused on qualitative magnetic topology analysis rather than quantitative measurements. As shown in Fig. A.1(a and b), the un-rotated HRT and HRI maps shared similar FOVs but exhibited coordinate offsets, requiring manual alignment. Our alignment approach relied on identifying characteristic features. For instance, in panels Figs. A.1c1 and A.1d1, we see that the filament’s left footpoint and the nearby open field shared the same negative polarity. The nearby open field here could also be the bottom of large-scale coronal loops that do not really extend to interplanetary space, but can effectively be considered as open field, given their size relative to the filament. Further confirmation comes from comparing the footpoints of the eventually visible large loop, allowing us to identify its positive and negative footpoints in Fig. A.1c3. Notably, in Fig. A.1c2 we see a weak positive polarity emergence compared to the initial LOS magnetogram, coinciding with the location of the emerging flux loop in Fig. A.1d2. This observation supports our interpretation that flux emergence beneath the filament triggers jets along it. Meanwhile, we calculated the emergence rate of positive flux within the black circles in Figs. A.1c1 and A.1c2, corresponding to the emerging flux loop region. These findings demonstrate the crucial role of high-resolution magnetic data in studying filament fine-scale evolution.
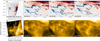 |
Fig. A.1. Comparison of PHI/HRT LOS magnetic field data with HRI observations. The emerging flux loop and its corresponding emerging flux region are marked in panels (c2) and (d2). The footpoints of the large loop are annotated in panels (c3) and (d3). The PHI/HRT maps were shifted by (+15″, -140″) to align with the HRI map based on identifying characteristic features. |
Furthermore, with the magnetic field configuration confirmed, let us turn our attention to this filament’s interesting double-layer structure. The origin of double-decker filaments is an open question. In previous studies, these structures have been generally considered to originate from the splitting of a single filament (Liu et al. 2012; Tian et al. 2018; Dai et al. 2022; Zhang et al. 2022). More recently, it has been suggested that they arise from the successive eruption of two magnetic flux ropes (Shen et al. 2024). Here, we examine this question by analyzing jet motion through the filament structure. There were multiple jets during the filament eruption (Fig. 1c), and the initial jet was very slender and concentrated. However, before the filament erupts, the jet had already bifurcated (Fig. 1d1), and this remains true after the filament eruption as well. By tracing the bifurcation of jets generated at the filament footpoints, previous study found that the coronal cavity and the filament are different parts of a single magnetic flux rope, with the two components separated in height (Tan et al. 2022; Gibson & Fan 2006). Following this idea, we argue that continuously emerging flux loops reconnect with the filament, leading to the splitting of the filament, and that the jets generated by the reconnection exhibit bifurcations along the newly formed double-layer structure, respectively. However, high temporal magnetic field data are currently not available, and we will continue to discuss this question in future work.
Appendix B: Magnetic reconnection in the heliosphere system
Finally, let us place the reconnection term in a broader heliospheric context. Magnetic flux rope erosion, a key process affecting CMEs during their interplanetary propagation, was first identified through observations of interaction between flux ropes and ambient solar wind magnetic fields (Gosling & McComas 1987). A significant advancement came when it was demonstrated quantitatively how magnetic reconnection removes flux from the rope’s outer layers and creates open field lines (Dasso et al. 2007). Further characterization of this process provided detailed analysis of reconnection locations and erosion rates. Studies revealed that the majority of erosion (47-67%) occurs within 0.39 AU of the Sun (Ruffenach et al. 2015), highlighting the importance of inner heliosphere dynamics. More recent work has shown how this erosion process varies with the solar cycle and affects the geo-effectiveness of CMEs (Pal et al. 2020, 2021), adding another layer to our understanding of this complex phenomenon.
The filament persistent magnetic reconnection proposed in this work is distinct from flux rope erosion (previously widely used in space physics) in several key aspects:
-
Scale: Persistent magnetic reconnection involves multiple small-scale reconnection events (101 − 102 Mm for the filament-scale in our event), while flux rope erosion typically occurs through large-scale reconnection (104 − 105 Mm for typical interplanetary magnetic-clouds-scale).
-
Location: Filament persistent magnetic reconnection takes place in the low corona before and during eruption, whereas flux rope erosion happens during interplanetary propagation.
-
Reconnection characteristics: Persistent magnetic reconnection exhibits frequent, distributed small-scale reconnection events around the structure, compared to the primarily front/rear localized reconnection in flux rope erosion.
-
Effects: Persistent magnetic reconnection influences the structural stability and eruption dynamics of filament, while flux rope erosion mainly affects magnetic flux content and helicity.
These differences suggest that magnetic reconnection processes in the solar atmosphere and the solar wind operate across multiple scales and regimes, with distinct physical mechanisms and consequences for solar eruptions.
All Figures
|
Fig. 1. (a): Full-disk image of EUI in 174 Å (inverted grayscale) superposed with HRIEUV, with the relative positions of Solar Orbiter. (b): Image of HRIEUV (rotated to facilitate the analysis), with the centrally positioned white box (also the FOV of panel d and its enlargement labeled with the target filament position). (c): Multiple jets throughout the filament eruption. (d1)–(d6): Filament evolution in HRIEUV images. Different features are annotated. The dashed blue line in panel d5 indicates the slice position. (e): Intensity profiles (blue) along the slice; the red and yellow curves fitted with a Gaussian indicate the UF and LF position, respectively, and the double-decker filament centers are indicated with dashed lines. (f): Time-space plot of the filament eruption; the UF and LF eruption speeds are labeled, and the time corresponds to panel d5. |
| In the text | |
|
Fig. 2. (a)–(d): LF eruption process. The FOV is marked with dashed white boxes in panel f. (e): Small post-flare loop produced by the LF eruption. The loop region is represented by the dashed red box. (f): Large loop visible after the LF eruption. The left footpoint region is represented by the dashed blue box. (g): Normalized light curves corresponding to the dashed red and blue boxes. The moments of the small and large loops are marked, as are moments of multi-jet and filament eruptions. |
| In the text | |
|
Fig. 3. (a): Reconnection process of the double-decker filament, the nearby open field, and the emerging flux loop at the bottom. Orange and green curves represent the UF and LF, and blue the nearby open field. (b): Small post-flare loop formed by the filament lifting stretching the lower closed field and the large loop formed by the falling filament material. The bottom space is divided into three ranges to indicate the magnetic field around the filament. |
| In the text | |
|
Fig. A.1. Comparison of PHI/HRT LOS magnetic field data with HRI observations. The emerging flux loop and its corresponding emerging flux region are marked in panels (c2) and (d2). The footpoints of the large loop are annotated in panels (c3) and (d3). The PHI/HRT maps were shifted by (+15″, -140″) to align with the HRI map based on identifying characteristic features. |
| In the text | |
Current usage metrics show cumulative count of Article Views (full-text article views including HTML views, PDF and ePub downloads, according to the available data) and Abstracts Views on Vision4Press platform.
Data correspond to usage on the plateform after 2015. The current usage metrics is available 48-96 hours after online publication and is updated daily on week days.
Initial download of the metrics may take a while.