Fig. 2.
Download original image
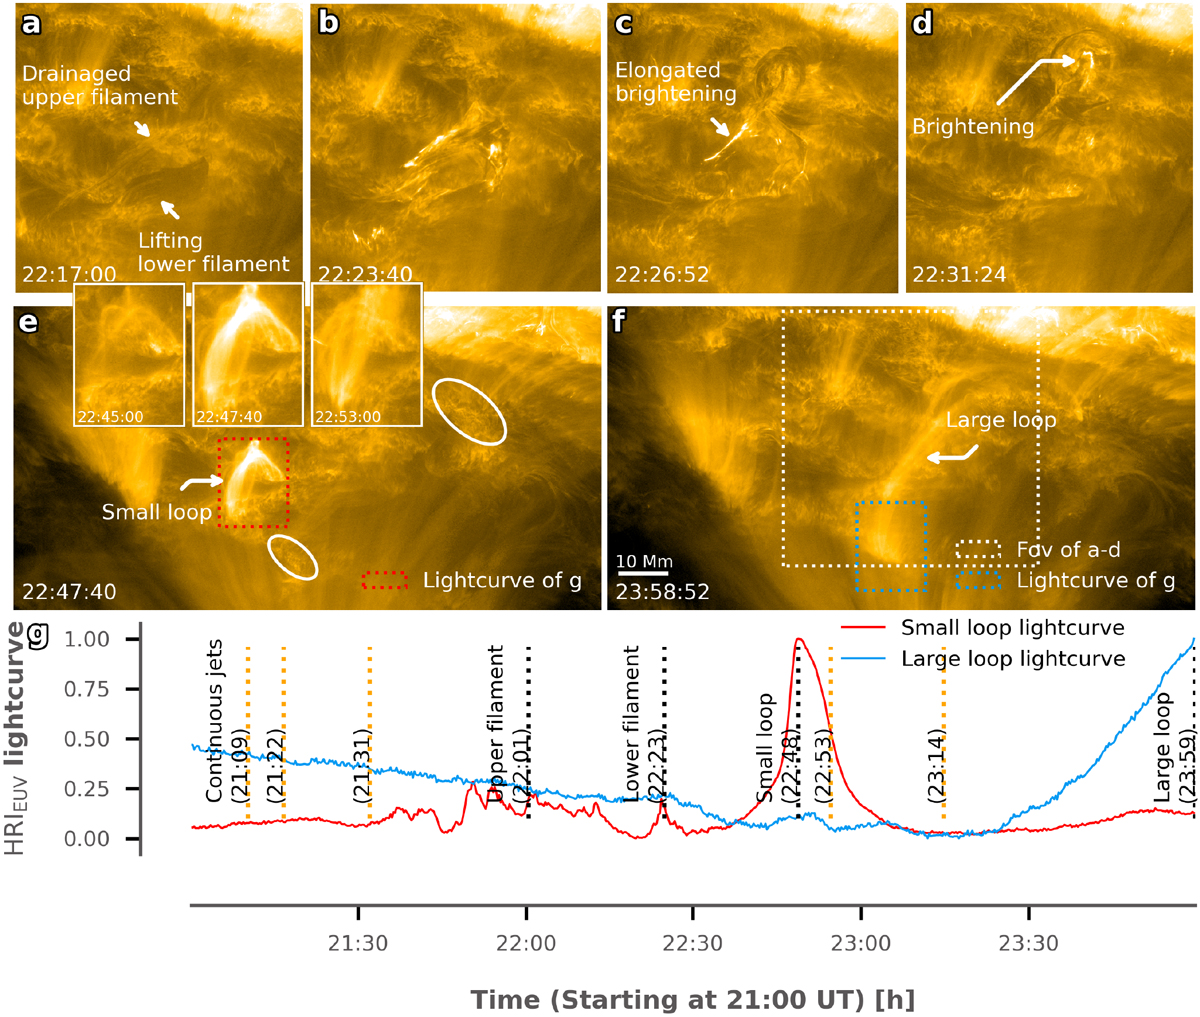
(a)–(d): LF eruption process. The FOV is marked with dashed white boxes in panel f. (e): Small post-flare loop produced by the LF eruption. The loop region is represented by the dashed red box. (f): Large loop visible after the LF eruption. The left footpoint region is represented by the dashed blue box. (g): Normalized light curves corresponding to the dashed red and blue boxes. The moments of the small and large loops are marked, as are moments of multi-jet and filament eruptions.
Current usage metrics show cumulative count of Article Views (full-text article views including HTML views, PDF and ePub downloads, according to the available data) and Abstracts Views on Vision4Press platform.
Data correspond to usage on the plateform after 2015. The current usage metrics is available 48-96 hours after online publication and is updated daily on week days.
Initial download of the metrics may take a while.