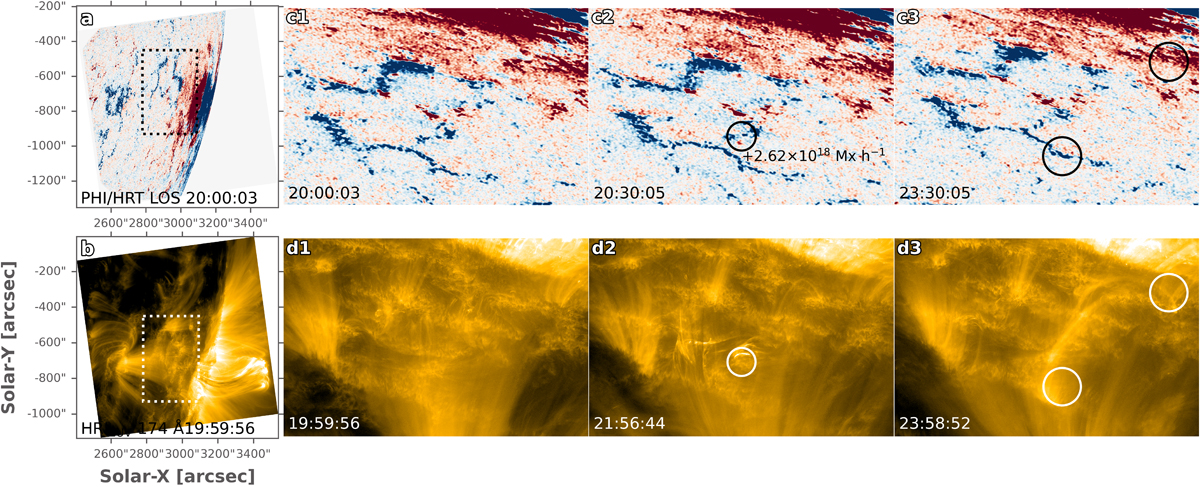
Fig. A.1.
Download original image
Comparison of PHI/HRT LOS magnetic field data with HRI observations. The emerging flux loop and its corresponding emerging flux region are marked in panels (c2) and (d2). The footpoints of the large loop are annotated in panels (c3) and (d3). The PHI/HRT maps were shifted by (+15″, -140″) to align with the HRI map based on identifying characteristic features.
Current usage metrics show cumulative count of Article Views (full-text article views including HTML views, PDF and ePub downloads, according to the available data) and Abstracts Views on Vision4Press platform.
Data correspond to usage on the plateform after 2015. The current usage metrics is available 48-96 hours after online publication and is updated daily on week days.
Initial download of the metrics may take a while.