Open Access
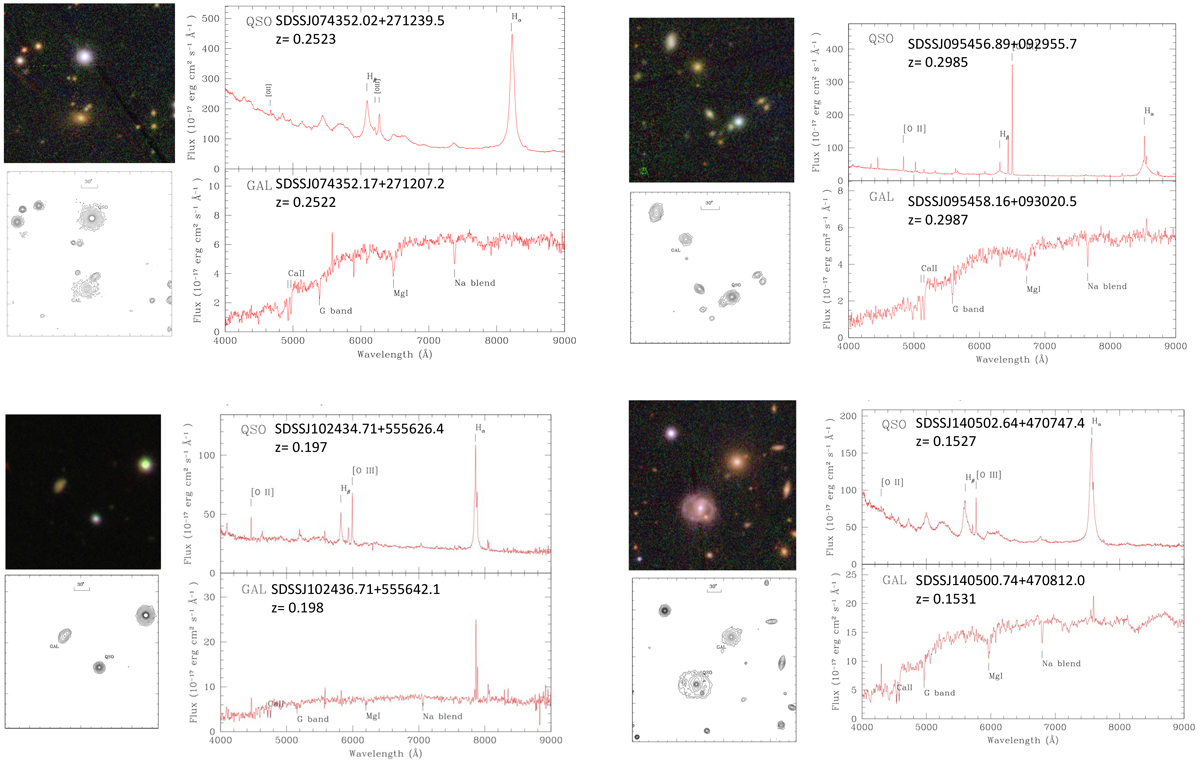
Fig. 2.
Download original image
Top-left: Colour image of the field from SDSS DR16 (Field 2.5 × 2.5 arcmin; north is up east is left). Bottom-left: Contour plot of the field. Right: Optical spectrum of the QSO (top) and that of the companion galaxy (bottom). The main spectral features in the QSO and the companion galaxy are marked.
Current usage metrics show cumulative count of Article Views (full-text article views including HTML views, PDF and ePub downloads, according to the available data) and Abstracts Views on Vision4Press platform.
Data correspond to usage on the plateform after 2015. The current usage metrics is available 48-96 hours after online publication and is updated daily on week days.
Initial download of the metrics may take a while.