| Issue |
A&A
Volume 702, October 2025
|
|
|---|---|---|
| Article Number | A232 | |
| Number of page(s) | 8 | |
| Section | Extragalactic astronomy | |
| DOI | https://doi.org/10.1051/0004-6361/202555317 | |
| Published online | 24 October 2025 | |
SDSS low-z quasar companion galaxies
1
INAF – Osservatorio Astronomico di Padova, Vicolo dell’Osservatorio 5, I-35122 Padova, (PD), Italy
2
INAF – IASF Palermo, Via Ugo La Malfa 153, I-90146 Palermo, Italy
⋆ Corresponding authors: This email address is being protected from spambots. You need JavaScript enabled to view it.
; This email address is being protected from spambots. You need JavaScript enabled to view it.
; This email address is being protected from spambots. You need JavaScript enabled to view it.
Received:
28
April
2025
Accepted:
11
September
2025
Abstract
We investigate the relationship between quasars (QSOs) and close companion galaxies using photometry and spectroscopy from the large dataset of the SDSS DR16 survey. Using the SDSS-QSO catalogue of quasars, we selected objects with 0.1 < z ≤ 0.35 and absolute magnitude M(r) < − 21.3. For all these targets, we searched for candidate companion galaxies located at a projected distance from the target of < 700 kpc and a radial velocity difference from the QSO of ΔV < 1000 km/s. We find that in 447 QSOs at least one companion galaxy was found to be associated. A total of 691 associated galaxies were found in these QSO fields. In the majority there was just one associated galaxy however in several cases a number of companion were also discovered and in two cases the QSO was found in a rich galaxy environments. We note that the possible contamination attributed to a chance projection of the companion galaxies is less than 5%. Based on the available data we expected to find on average ∼2 associated companion galaxies for each QSO. A small fraction (13%) of the companion galaxies exhibit [OII] emission lines as signature of recent star formation. However a similar fraction (16%) of unassociated galaxies in the same QSO fields exhibit [OII] emission. Overall this study suggests that there is no significant link between the presence of these close companion galaxies or the signature of recent star formation and QSO nuclear activity.
Key words: galaxies: active / galaxies: evolution / quasars: absorption lines / quasars: emission lines / quasars: general
© The Authors 2025
 Open Access article, published by EDP Sciences, under the terms of the Creative Commons Attribution License (https://creativecommons.org/licenses/by/4.0), which permits unrestricted use, distribution, and reproduction in any medium, provided the original work is properly cited.
This article is published in open access under the Subscribe to Open model. This email address is being protected from spambots. You need JavaScript enabled to view it. to support open access publication.
1. Introduction
The impact of the environment in triggering quasar activity is a crucial issue in the context of the specific mechanisms driving nuclear activity (Shanks et al. 1988; Shen et al. 2017; Sánchez & González-Serrano 2002). Several studies have examined the interplay between local and large-scale environments and their collective influence on quasar activity however this is a still subject of active debate (see e.g. Hewett et al. 1992). The key question considers whether quasar activity is triggered by mergers, as suggested by a galaxy environment around quasars that is comparatively or whether there are alternative explanations.
Nuclear activity in quasars is often assumed to occur due to a major merger of two gas-rich galaxies that feed the central engine and enable the growth of a stellar spheroid. However, the details of what triggers the gas fueling and how nuclear activity affects the subsequent evolution of the host galaxies remain puzzling. The correlations observed between the black hole (BH) mass (MBH) and the properties of the associated galaxy bulge as per MBH − σstars (Ferrarese & Merritt 2000) or  (Kormendy & Ho 2013) seem to point to a co-evolution among BH and spheroids however neither of these relations have clarified the role played by the environment, which is a fundamental component in investigating issues of quasar activity and its role in the evolution of galaxies. Minor and major mergers could play a key role in triggering and fueling nuclear activity however, although mergers are relevant as possible drivers of activity, it is still a matter of debate how this affects the active galactic nucleus (AGN). The global properties of the galaxy environment are likely to be the main drivers of the AGN activity (i.e. Kauffmann & Haehnelt 2000; Di Matteo et al. 2005).
Recent studies of the connection between environment and AGN activity in the nearby Universe (z < 0.5), have greatly benefitted from the use of SDSS data that enable investigations of large datasets of quasars. Using SDSS data the environment of nearby quasars was analyzed by various authors with somewhat different results. Coldwell & Lambas (2006) found that nearby quasars avoid high galaxy density regions and that the galaxies close to quasars usually have a disc-type morphology and a high star formation rate. Later, Strand et al. (2008) compared the environment of nearby QSO with those of low-luminosity AGN chosen from the photometric galaxy sample of the SDSS and found that quasars lie in higher density regions than the AGNs at scales of less than 2 Mpc.
In recent years in a series of papers Falomo et al. (2014), Bettoni et al. (2015, 2017), Stone et al. (2021), Bettoni et al. (2023) have exploited an imaging study of both the host galaxy properties and the environment of a sample of low redshift QSO (z < 0.5) in the SDSS Stripe82 area. With regard to the environment, Karhunen et al. (2014) found that quasars are on average found associated with small groups of galaxies. The over-densities of galaxies are mainly observed in the closest (< 200 kpc) region around the source and almost vanish beyond a distance of 1 Mpc. While the imaging studies of the galaxy environments can be carried out for extensive sample of targets the spectroscopic study of the galaxies in the close environment of QSO remains a unique approach probing the QSO-galaxy association and thus to investigate its role in spurring nuclear activity.
A number of pioneering works (see e.g. Hutchings 2001, and references therein) secured the spectroscopy of galaxies in the vicinity to quasars and revealed that in some cases they are in fact found at the same redshift of the QSO in question. Moreover many of these cases exhibited some signature of an interaction from a disturbed morphology. These observations suggested that interactions between the QSO host galaxy and the close companion could trigger and fuel nuclear activity (Araujo et al. 2023; Storchi-Bergmann et al. 2018; Steffen et al. 2023).
In a recent attempt to investigate this issue spectroscopically in a systematic way, we studied 34 low-z QSOs by obtaining long slit spectra of their companion galaxies (see Bettoni et al. 2017; Stone et al. 2021) and 10 low-z QSO companion galaxies using MOS spectra (Bettoni et al. 2023). These objects were selected from a sample of 416 quasars in the SDSS Stripe 82 area for which both the host galaxy and the large-scale environments were previously investigated (Falomo et al. 2014; Karhunen et al. 2014; Bettoni et al. 2015). It was found that in about half of the targets the observed companion was associated with the QSO and in most of them some signature of recent star formation could be inferred from the presence of the [OII] emission line. However, the SFR is rather modest (< 5 Myr−1) and favors a scenario where the link between SF and nuclear activity is of little significance.
For these 44 QSOs, we found that for about half (19) there is at least one associated companion.
We also found that many of the associated companions and some host galaxies exhibit episodes of (recent) star formation possibly induced by past interactions (Stone et al. 2021). However, the star formation rate (SFR) of the companion galaxies is modest, and the role of the quasar remained uncertain.
In this work, we extended the analysis of the QSO-galaxy associations for the SDSS-QSO catalogue (Lyke et al. 2020) and using a much larger dataset than previous studies. We utilized all the available photometric and spectroscopic data from SDSS-DR16 (Ahumada et al. 2020). This paper is organised as follows. The data sample is presented in Section 2 followed by our analysis in Section 3. In Section 4 are present the main results and our conclusion in Section 5. The results were obtained in the framework of the concordance cosmology, using H0 = 70 km s−1 Mpc−1, Ωm = 0.3, and Ωλ = 0.7. We note that in this work, we use ‘quasar’ and ‘QSO’ interchangeably.
2. The SDSS sample of QSO-galaxy association
We used the SDSS DR16 quasar-only catalogue (Lyke et al. 2020) to extract the targets with 0.1 < z ≤ 0.35. This search resulted in 6700 QSO. The latter set contains objects classified as quasar of absolute magnitude in the range −18 < M(r) < − 25. This catalogue does indeed include very low luminosity sources that are classified as quasars. To remain consistent with previous studies on quasar environments (see e.g. Falomo et al. 2014) we decided to cut the set removing all targets with absolute magnitude M(r) of ≤21.3. This resulted in a dataset of 4544 objects. For this QSO sample, we searched in the SDSS DR16 database (Ahumada et al. 2020) for possible spectroscopic companion galaxies in the QSO fields with a search radius of 2.5 arcmin corresponding to a maximum projected distance from the QSO in the range ∼250 to 750 kpc.
We searched for all objects classified as galaxies by SDSS that are in the redshift range 0.1 < z < 0.35 and with apparent magnitude mr < 21.0 to exclude bad quality spectra. This sample was composed of 2879 galaxies in 1900 QSO fields. Of these galaxies there are 773 that have a velocity difference (based on SDSS redshift) with respect to the QSO ΔV < 1000 km/s. These galaxies are distributed in 524 QSO fields. This implies that a significant fraction (27%) of the explored QSO fields have at least one associated companion galaxy.
In spite of having similar redshift both the QSO and the companion galaxy, it could be that in some cases they are not really associated because of a chance coincidence of their redshifts. Although the effect is expected to be small, it is useful to get an estimate. To this aim, we performed a test based on a random assignment of a redshift to each galaxy taken from the whole set of redshift of the 2879 galaxies. Then we looked again for the QSO-galaxy pairs with ΔV < 1000 km/s.
We performed the above test for 1000 iterations and found that the average number of false pairs from the whole set of 2879 is 80 ± 8.5. Therefore we were able to estimate that the level of contamination by fake pairs in our sample of 2879 galaxies is ∼3%.
3. Analysis of the spectra of QSO and companion galaxies
We retrieved all the spectra both for the QSO and for the companion galaxies from SDSS DR16 database. We then measured the redshift and the equivalent width (EW) for all the emission lines of the QSOs. Since we aimed to find QSO companion galaxies with ΔV < 1000 km/s, it is important for the QSO spectrum to be of adequate quality to enable an adequate measurement of the system’s radial velocity from the narrow emission lines. Therefore from the original list of 524 QSOs we removed the ones whose spectrum was not sufficient to provide an adequate quality measurement of the radial velocity. For this purpose we checked the EW of [OIII] and Hβ and removed all the QSOs with EW < 5 Å for both [OIII] and Hβ from the sample as the S/N ratio is < 3 below this level.
Following these revisions, the total number of usable QSOs was 476. For this sub-sample, we found 691 companion galaxy candidates. To preserve a sound measurement of the radial velocity difference between QSO and companion galaxy, we also checked the quality of the spectra and removed all galaxies with S/N < 3, which implies an EW of CaII H and K absorption feature < 3 Å. In addition we measured the radial velocity (RV) of both H and K and removed the objects for which the difference of RV (between the H and K lines) is > 500 km/s (i.e. significantly greater than the average difference of ∼200 km/s for the whole dataset of galaxies). In these cases it turned out that at least one of the two absorption lines was very noisy and therefore their measurement was more uncertain. Thus the final sample of companion galaxies was reduced to 651 sources in 447 QSO fields. This sample is very similar (see Fig. 1) in terms of QSO luminosity to the one used in our previous study (Falomo et al. 2014) of low-z QSOs.
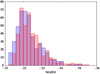 |
Fig. 1. Absolute magnitude distribution of 447 (blue) QSO (this work) compared with the distribution of a sample of 416 QSO (red) from SDSS Stripe 82 survey (Falomo et al. 2014). |
We then compared our redshift measurements of companion galaxies based on the barycentre of CaII H and K absorption lines with those provided by SDSS database that are based on the use of all features. We derived the difference between the redshift given by SDSS and that obtained by our measurements of the CaII H and K and MgI 5175 Å absorption lines for all the companion galaxies. For most of the targets the redshift difference was < 200 km/s. However, in a number of cases we found a redshift difference as large as 500 km/s. This difference could be due to the number of features amployed since the redshift derived by SDSS analysis was based all available spectral features ehich might be of differing levels of quality. In these cases we checked the accuracy our measurements based on the fit of the barycentre of H and K and a S/N > 5.
Since our key parameter for the characterisation of the QSO-galaxy association is the difference in the radial velocity in the following we consider only the values derived from our measurements.
In Figure 2 we report the optical spectra of four examples of QSO with their companion galaxies together with the images of the fields.
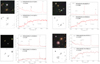 |
Fig. 2. Top-left: Colour image of the field from SDSS DR16 (Field 2.5 × 2.5 arcmin; north is up east is left). Bottom-left: Contour plot of the field. Right: Optical spectrum of the QSO (top) and that of the companion galaxy (bottom). The main spectral features in the QSO and the companion galaxy are marked. |
4. Results
After the sample was cleaned (see details in Sect. 3), we found that in 447 QSO fields there is at least one companion galaxy with a radial velocity difference of ΔV < 1000 km/s. In the majority (342; 65%) of these fields there is just one associated galaxy; for the remaining fields we found two companions in 60 fields, and three companionsin 24 fields, finally more than three companions in 21 fields. In two cases we found that the QSO resides in a rich group of galaxies (with 8 and 12 galaxies respectively) satisfying our association criterion (see details in Appendix A).
The distribution of the absolute magnitude (Mr) of the companion galaxies is shown in Figure 3. The companion galaxy absolute magnitude spans a wide range of values from −19.5 to −23.5 and are distributed uniformly with respect to the projected distance. The median value of the projected distance of companion galaxies of different absolute magnitude is very similar (327 ± 22 kpc, assuming four bins of absolute magnitude). It is worth noting that a number (32) of these companion galaxies are very luminous (Mr < −23.0). The majority of these luminous galaxies are passive galaxies at z > 0.25, two are LINERs, and one is a star forming (SF) galaxy (SDSS J152551.99+181254.0) with a disk-like morphology. We note also that half of these luminous companion galaxies are found in QSO fields with more than one companion galaxy compared to a smaller fraction (25%) for the companions in the whole QSO sample of 447 (see also Table 1).
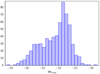 |
Fig. 3. Absolute magnitude (Mr) distribution of 651 companion galaxies in 447 QSO fields (see text). The average absolute magnitude is ⟨Mr⟩= − 21.8 ± 0.9. |
4.1. Statistics of companion galaxies
Since our search for companion galaxy candidates is limited to a beam of 2.5 arcmin in radius (see Sect. 2) the explored range of projected distance of these galaxies with respect to the QSO depends on the redshift of the QSO. To evaluate the fraction of QSO that exhibit associated companion galaxies, we defined two sub-samples that homogeneously cover the explored range of redshift and of projected distance of the companion galaxies from the QSO. These sub-samples are extracted from the whole sample described in Section 2.
The first sub-sample (sub-sample A) was set at the maximum projected distance (PD) at 300 kpc and covers the whole range of redshift of the QSO sample (see Fig. 4). There are 1324 galaxies for 1053 QSO fields. About 30% (355 galaxies) of them appear to be associated with the 297 QSO according to the ΔV < 1000 km/s criterion. The other (969 objects) are non-associated galaxies (ΔV > 1000 km/s). Adopting the same test for the chance projection objects described in Sect. 2, we found that that only ∼2% of them can be spurious.
The second sub-sample, sub-sample B, is defined in the redshift range 0.25 < z < 0.35 and at a maximum PD of 600 kpc (see Fig. 4). There are 989 galaxies for 716 QSO fields. About 37% (371 galaxies) of them appears associated with the 263 QSO according to the ΔV < 1000 km/s criterion. The other (618 galaxies) are non-associated (ΔV > 1000 km/s). In this case the fraction of chance projection objects is of ∼5%.
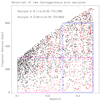 |
Fig. 4. Definition of the two sub-samples of companion galaxies (see text). Red and black point represent galaxies that are associated and not associated with the QSO, respectively. The two rectangles define the sub-samples (see also text). Sub-sample A (magenta rectangle): 0.1 < z < 0.35 and PD < 300 kpc. Sub-sample B (blue rectangle): 0.25 < z < 0.35 and PD < 600 kpc. |
The statistics of the companion galaxies compared to the non-associated galaxies in the field are summarised in Table 1.
4.2. Expected number of QSO companion galaxies
In order to evaluate the frequency of expected companion galaxies in the range of mag 15.5 to 21 and with PD < 700 kpc from the QSO, we counted the number of galaxies in each field of the 4544 QSO. We found 98 105 galaxies with these properties. However, there are only 3112 QSO fields with at least one galaxy charcterised by spectroscopic observations. Considering only these fields, we have 72 042 galaxies that satisfy the above conditions of magnitude and projected distance assuming the redshift of the QSO. Of these companion galaxy candidates only 6379 (about 9%) have at least one optical spectrum.
From the comparison of the redshifts of the 6379 galaxies with that of the QSO, we found that 781 galaxies (about 12%) in 527 QSO fields the velocity difference with respect to the QSO is < 1000 km/s, indicating that they are likely associated with the QSO.
Therefore, in our study we found that about 17% of the QSO have at least a companion galaxy as defined above, and for each QSO (on average) there are ∼1.5 spectroscopic companions.
Since the spectroscopic coverage of QSO fields is limited to ∼9% of all galaxies in the fields, we would expect to find many more associated companion galaxies in the case of a complete spectroscopic coverage of the galaxies in the QSO fields.
To estimate the expected number of associated companion galaxies, we evaluated the number of associated companion galaxies (i.e. those with ΔV < 1000 km/s from the QSO redshift) with respect to the number of galaxies in the field that have a spectrum. This fraction reaches a peak of about 30% around a magnitude of 19 and decreases at brighter and fainter magnitudes of the galaxies. We note that DR16 release includes data from other surveys (as BOSS, EBOSS, SEQUELS Dawson et al. 2013, 2016) with respect to standard SDSS survey (Strauss et al. 2002). Therefore a larger number of galaxies can be used as fainter spectroscopic targets.
We assume the observed fraction of associated companion galaxies is representative of all galaxies in the QSO fields since the selection of the galaxies with a spectrum is independent on the QSO. Since the above fraction strongly depends on the magnitude we estimate the number of expected companion galaxies in each magnitude bin by multiplying the above fraction by the number of all galaxies in all the 3112 QSO fields. The distribution of expected companion galaxies as a function of magnitude is shown in Figure 5. On average we found that in a QSO of this sample, we would expect to find 2.2 associated galaxies.
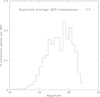 |
Fig. 5. Expected number of associated companion galaxies for the 3112 QSO fields as a function of the galaxy magnitude. This is derived from the observed fraction of companion galaxies with spectroscopic observations and the magnitude distribution of all galaxies in the defined QSO fields (see text). On average we found that for a QSO we would expect to have 2.2 associated galaxies. |
4.3. Emission line properties of companion galaxies
We searched for the presence of [OII] 3727 Å and [OIII] 5007 Å emission line in the spectra of companion galaxies and compared them with the galaxies in the fields that are not associated with the QSO which and are in the same redshift and luminosity range as the companion galaxies.
We limited our search to the emission lines that have a sufficient S/N thus we excluded all lines for which their EW values have an error of over 30%. Under these conditions, we found that the 13% (102 objects) of companion galaxies of QSO have [OII] in emission compared to 16% (120 galaxies) of the galaxies that are not associated. For both samples the [OII] luminosity is in the range of 40 < log(L[OII]) < 41.5 with an almost identical median value (log(L[OII]) = 40.69) for the companion galaxies and (log(L[OII]) = 40.68) for the non-associated objects. In Fig. 6, we show the distribution of log(L[OII]) luminosities for both associated and non-associated galaxies. We note also that about 50% of the companion galaxies with [OII] emission are at PD less than 250 kpc (see Fig. 7).
 |
Fig. 6. Distribution of [OII] luminosity of associated companion galaxies (blue) to QSO compared to that of not associated galaxies (red). |
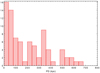 |
Fig. 7. PD distribution of QSO companion galaxies showing [OII] emission lines. |
A similar situation is also apparent for the [OIII] 5007 emission line. We found that the 6% (48 objects) of companion galaxies of QSO have [OIII] in emission compared to ∼7% (51 galaxies) of non-associated galaxies. Even in this case a similar range of [OIII] luminosity (40 < log(L[OIII]) < 42) was found for both samples. We note that the median value of Mr for our companion galaxies is −20.9, very close to the M* value for field galaxies M* = −20.44 (e.g. Blanton et al. 2003) but lower than the galaxies that are in clusters M* = −21.4 (e.g. Christlein & Zabludoff 2003).
It turns out that there are not significant episodes of recent star formation in the companion galaxies of QSO as the same level of activity also appears in the galaxies in the fields which also happen to have similar luminosity to the companion galaxies but are not associated with the QSO (ΔV > 1000 km/s).
5. Summary and conclusions
We searched the SDSS DR16 databasefor companion galaxy candidates residing in the vivinity of low-redshift (0.1 < z < 0.35) QSOs. The association between the QSO and the galaxy is based on the spectrum and a projected distance of less than 700 kpc from the QSO with a radial velocity difference of ΔV < 1000 km/s between the QSO and galaxy. Under these conditions (and after discarding a number of objects with poor quality spectra), we found 651 companions for 447 QSO fields. For the majority of the QSO only one companion is present, but in a few cases the QSO was shown to be part of a relatively rich group of galaxies (see also Appendix A). Based on the availability of spectroscopic galaxy spectral data of the large QSO sample, we would expect to find an average of about two companion galaxies associated with the QSO.
To test the fraction of possible spurious association (QSO-companion galaxy), we performed a test by randomly mixing the redshift of the companions and then searched again for the associated galaxies. We ran this test 1000 times and found in all cases that the number of chance projected pairs is always less than 5%.
The average absolute magnitude of the companion galaxies is Mr = −21.8 (median Mr = −20.9) and spans from low luminosity galaxies (Mr ∼ −19) to massive objects (Mr ∼ −24). The projected distance of the companion galaxies does not appear to be correlated with either the number of companions or the difference of radial velocity with the QSO.
The majority of the companion galaxies do not exhibit any spectral signature of recent star formation. Moreover, the small fraction (∼16%) of companion objects that have [OII] 3727 Å emission line appear similar in quantity and line luminosity to the galaxies in the field of QSO that are not associated with the target. However, the companion galaxies that exhibit emission lines are more often found at small projected distances from the QSO. For instance while at PD < 100 kpc the fraction of galaxies with emission lines is 36% in the region 100 < PD < 700 kpc the fraction of companion galaxies with emission lines is only 8%.
From the galaxy environment spectroscopic study of these low-redshift QSO, we did not find a strong link between the QSO nuclear activity and the presence of these close companion galaxies or any enhanced signature of recent star formation. Nevertheless we have found that although, QSO are generally found in poor (few companions present) environments, a small fraction of QSOs are located in relatively rich groups of galaxies (see details in Appendix A).
Data availability
The derived catalog of QSOs with companions is available at the CDS via https://cdsarc.cds.unistra.fr/viz-bin/cat/J/A+A/702/A232
Acknowledgments
We thank the anonymous referee for very helpful comments and suggestions. Funding for the Sloan Digital Sky Survey IV has been provided by the Alfred P. Sloan Foundation, the U.S. Department of Energy Office of Science, and the Participating Institutions. SDSS-IV acknowledges support and resources from the Center for High-Performance Computing at the University of Utah. The SDSS web site is www.sdss.org. SDSS-IV is managed by the Astrophysical Research Consortium for the Participating Institutions of the SDSS Collaboration including the Brazilian Participation Group, the Carnegie Institution for Science, Carnegie Mellon University, the Chilean Participation Group, the French Participation Group, Harvard-Smithsonian Center for Astrophysics, Instituto de Astrofísica de Canarias, The Johns Hopkins University, Kavli Institute for the Physics and Mathematics of the Universe (IPMU)/University of Tokyo, the Korean Participation Group, Lawrence Berkeley National Laboratory, Leibniz Institut für Astrophysik Potsdam (AIP), Max-Planck-Institut für Astronomie (MPIA Heidelberg), Max-Planck-Institut für Astrophysik (MPA Garching), Max-Planck-Institut für Extraterrestrische Physik (MPE), National Astronomical Observatories of China, New Mexico State University, New York University, University of Notre Dame, Observatário Nacional/MCTI, The Ohio State University, Pennsylvania State University, Shanghai Astronomical Observatory, United Kingdom Participation Group, Universidad Nacional Autónoma de México, University of Arizona, University of Colorado Boulder, University of Oxford, University of Portsmouth, University of Utah, University of Virginia, University of Washington, University of Wisconsin, Vanderbilt University and Yale University.
References
- Ahumada, R., Prieto, C. A., Almeida, A., et al. 2020, ApJS, 249, 3 [Google Scholar]
- Araujo, B. L. C., Storchi-Bergmann, T., Rembold, S. B., Kaipper, A. L. P., & Dall’Agnol de Oliveira, B. 2023, MNRAS, 522, 5165 [NASA ADS] [CrossRef] [Google Scholar]
- Bettoni, D., Falomo, R., Kotilainen, J. K., Karhunen, K., & Uslenghi, M. 2015, MNRAS, 454, 4103 [NASA ADS] [CrossRef] [Google Scholar]
- Bettoni, D., Falomo, R., Kotilainen, J. K., & Karhunen, K. 2017, MNRAS, 466, 3600 [Google Scholar]
- Bettoni, D., Falomo, R., Paiano, S., Kotilainen, J. K., & Stone, M. B. 2023, MNRAS, 519, 2929 [Google Scholar]
- Blanton, M. R., Hogg, D. W., Bahcall, N. A., et al. 2003, ApJ, 592, 819 [Google Scholar]
- Christlein, D., & Zabludoff, A. I. 2003, ApJ, 591, 764 [Google Scholar]
- Coldwell, G. V., & Lambas, D. G. 2006, MNRAS, 371, 786 [NASA ADS] [CrossRef] [Google Scholar]
- Dawson, K. S., Schlegel, D. J., Ahn, C. P., et al. 2013, AJ, 145, 10 [Google Scholar]
- Dawson, K. S., Kneib, J.-P., Percival, W. J., et al. 2016, AJ, 151, 44 [Google Scholar]
- Di Matteo, T., Springel, V., & Hernquist, L. 2005, Nature, 433, 604 [NASA ADS] [CrossRef] [Google Scholar]
- Falomo, R., Bettoni, D., Karhunen, K., Kotilainen, J. K., & Uslenghi, M. 2014, MNRAS, 440, 476 [NASA ADS] [CrossRef] [Google Scholar]
- Ferrarese, L., & Merritt, D. 2000, ApJ, 539, L9 [Google Scholar]
- Hewett, P. C., Harding, M. E., Webster, R. L. 1992, Gravitational Lenses (Berlin, Heidelberg: Springer), 209 [Google Scholar]
- Hutchings, J. B. 2001, in QSO Hosts and Their Environments, eds. I. Márquez, J. Masegosa, A. del Olmo, et al., 71 [Google Scholar]
- Karhunen, K., Kotilainen, J. K., Falomo, R., & Bettoni, D. 2014, MNRAS, 441, 1802 [Google Scholar]
- Kauffmann, G., & Haehnelt, M. 2000, MNRAS, 311, 576 [Google Scholar]
- Kormendy, J., & Ho, L. C. 2013, ARA&A, 51, 511 [Google Scholar]
- Lyke, B. W., Higley, A. N., McLane, J. N., et al. 2020, ApJS, 250, 8 [NASA ADS] [CrossRef] [Google Scholar]
- Madrid, J. P., Chiaberge, M., Floyd, D., et al. 2006, ApJS, 164, 307 [NASA ADS] [CrossRef] [Google Scholar]
- Sánchez, S. F., & González-Serrano, J. I. 2002, A&A, 396, 773 [NASA ADS] [CrossRef] [EDP Sciences] [Google Scholar]
- Shanks, T., Tanvir, N. R., & Redfern, M. 1988, PASP, 100, 1226 [Google Scholar]
- Shen, L., Miller, N. A., Lemaux, B. C., et al. 2017, MNRAS, 472, 998 [NASA ADS] [CrossRef] [Google Scholar]
- Steffen, J. L., Fu, H., Brownstein, J. R., et al. 2023, ApJ, 942, 107 [NASA ADS] [CrossRef] [Google Scholar]
- Stone, M. B., Bettoni, D., Falomo, R., et al. 2021, MNRAS, 501, 419 [Google Scholar]
- Storchi-Bergmann, T., Dall’Agnol de Oliveira, B., Longo Micchi, L. F., et al. 2018, ApJ, 868, 14 [Google Scholar]
- Strand, N. E., Brunner, R. J., & Myers, A. D. 2008, ApJ, 688, 180 [NASA ADS] [CrossRef] [Google Scholar]
- Strauss, M. A., Weinberg, D. H., Lupton, R. H., et al. 2002, AJ, 124, 1810 [Google Scholar]
Appendix A: QSO in rich galaxy environments
From the selected dataset of 342 QSO with at least one companion galaxy (with PD < 700 kpc and Δ V < 1000 km/s we found two QSO that are in a relatively rich group of galaxies. In one case (QSO SDSS J133718.48+452335.1) there are 12 galaxies in the field that satisfy the above conditions. In another case (QSO SDSS J092108.61+453857.3) there are 8 companion galaxies. In 3 other QSOs we found 7 companion galaxies and in other 3 cases 6 galaxies. A summary of all these cases is given in Table A.1. In the following, we illustrate the properties for the two richer cases (QSO SDSS J133718.48+452335.1 at z = 0.317 and QSO SDSS J092108.61+453857.3 and Z = 0.175).
Low Z QSO with Ncomp ≥ 6
A.1. QSO SDSS J133718.48+452335.1
In Figure A.1 we show the field (5x5 arcmin) around the QSO SDSS J133718.48+452335.1 (Mr = −22.2) at z = 0.31689. There are 12 galaxies in the field with PD < 700 kpc and Δ V in the range 60 to 800 km/s (median = 330 km/s). The absolute magnitude of companion galaxies are in the range −23.4 < Mr < −20.7 (see Table A.2). We search for additional possible companion galaxies in the SDSS DR16 database in a larger field of view (PD < 1.5 Mpc). There are 8 more galaxies that have Δ V < 800 km/s. The QSO appears in the central region of this rich group of galaxies.
Companion galaxies of the low Z QSO SDSS J133718.48+452335.1
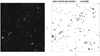 |
Fig. A.1. Field of the QSO SDSS J133718.48+452335.1 (FoV = 5x5 arcmin; Z = 0.31689). There are 12 companion galaxies with PD < 700 kpc and Δ V < 1000 km/s. |
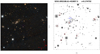 |
Fig. A.2. QSO SDSS J092108.61+453857.3 There are 8 companion galaxies with PD < 700 kpc and Δ V < 1000 km/s. Note that the companion N. 6 is itself a QSO at z = 0.1771 |
A.2. QSO SDSS J092108.61+453857.3 (3C 219) and Z = 0.1747
In Figure A.2 we show the field (5x5 arcmin) around the radio loud QSO SDSS J092108.61+453857.3 (Mr = −21.5) at z = 0.17473. There are 8 objects classified as galaxies in the field with PD < 400 kpc and Δ V < in the range 40 to 800 km/s (median = 614 km/s). The absolute magnitude of companion galaxies are in the range −22.4 < Mr < −19.8. Note that object N. 6 (see Table A.3 and Figure A.2) is a low redshift QSO (SDSS J092113.38+453716.5) with clear broad emission lines (z = 0.1771, Mr = −21.2). This target is part of a group of galaxies studied by (Madrid et al. 2006) from HST images. Also in this case, we search for other companion galaxies at PD < 1.5 Mpc. In this case no other galaxies that satisfy the association criteria are found.
Companion galaxies the low Z QSO SDSS J092108.61+453857.3
We also searched for other galaxies at PD < 1.5 Mpc in the other 6 cases with 6 and 7 companion galaxies (see Table A.1). For 3 QSO fields, we found a number of additional companion galaxies: 16 new members for SDSS J015331.78-012126.2, 9 members for SDSS J235941.35+120520.0 and 24 members for SDSS J073623.13+392617.7. In the remaining three cases no other companion galaxies are reveled.
All Tables
All Figures
|
Fig. 1. Absolute magnitude distribution of 447 (blue) QSO (this work) compared with the distribution of a sample of 416 QSO (red) from SDSS Stripe 82 survey (Falomo et al. 2014). |
| In the text | |
|
Fig. 2. Top-left: Colour image of the field from SDSS DR16 (Field 2.5 × 2.5 arcmin; north is up east is left). Bottom-left: Contour plot of the field. Right: Optical spectrum of the QSO (top) and that of the companion galaxy (bottom). The main spectral features in the QSO and the companion galaxy are marked. |
| In the text | |
|
Fig. 3. Absolute magnitude (Mr) distribution of 651 companion galaxies in 447 QSO fields (see text). The average absolute magnitude is ⟨Mr⟩= − 21.8 ± 0.9. |
| In the text | |
|
Fig. 4. Definition of the two sub-samples of companion galaxies (see text). Red and black point represent galaxies that are associated and not associated with the QSO, respectively. The two rectangles define the sub-samples (see also text). Sub-sample A (magenta rectangle): 0.1 < z < 0.35 and PD < 300 kpc. Sub-sample B (blue rectangle): 0.25 < z < 0.35 and PD < 600 kpc. |
| In the text | |
|
Fig. 5. Expected number of associated companion galaxies for the 3112 QSO fields as a function of the galaxy magnitude. This is derived from the observed fraction of companion galaxies with spectroscopic observations and the magnitude distribution of all galaxies in the defined QSO fields (see text). On average we found that for a QSO we would expect to have 2.2 associated galaxies. |
| In the text | |
|
Fig. 6. Distribution of [OII] luminosity of associated companion galaxies (blue) to QSO compared to that of not associated galaxies (red). |
| In the text | |
|
Fig. 7. PD distribution of QSO companion galaxies showing [OII] emission lines. |
| In the text | |
|
Fig. A.1. Field of the QSO SDSS J133718.48+452335.1 (FoV = 5x5 arcmin; Z = 0.31689). There are 12 companion galaxies with PD < 700 kpc and Δ V < 1000 km/s. |
| In the text | |
|
Fig. A.2. QSO SDSS J092108.61+453857.3 There are 8 companion galaxies with PD < 700 kpc and Δ V < 1000 km/s. Note that the companion N. 6 is itself a QSO at z = 0.1771 |
| In the text | |
Current usage metrics show cumulative count of Article Views (full-text article views including HTML views, PDF and ePub downloads, according to the available data) and Abstracts Views on Vision4Press platform.
Data correspond to usage on the plateform after 2015. The current usage metrics is available 48-96 hours after online publication and is updated daily on week days.
Initial download of the metrics may take a while.