Fig. 12
Download original image
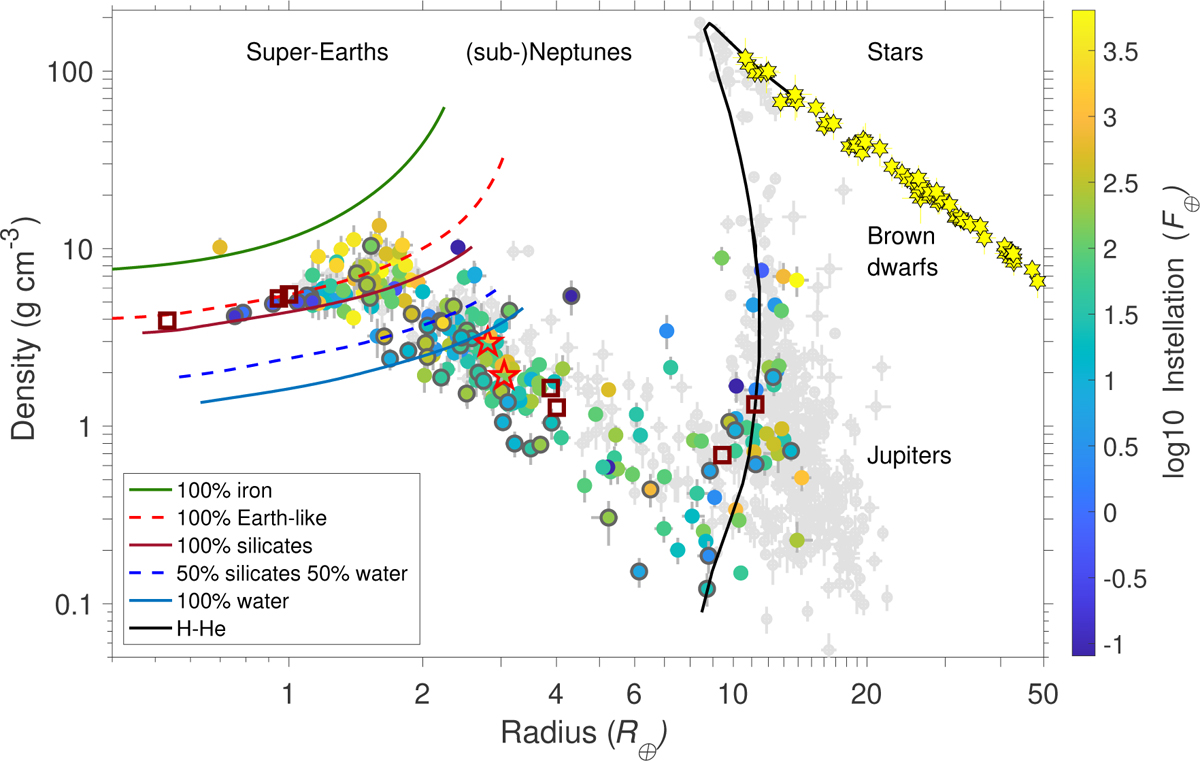
Density vs radius diagram of the 230 planets in 159 multiplanet systems with ≥2 planets from the NASA exoplanet archive with uncertainties better than 21% and 7% in mass and radius, respectively, color-coded with instellation. The planets plotted in grey are single planet systems. The masses are derived from RV measurements (181 planets) or from TTVs (49 planets outlined in dark grey), and the radii from transit photometry. Solar System planets are marked with brown squares. Low-mass stars are marked with yellow star symbols. TOI-1438 b and c are marked with red star symbols and fall within the diagonal strip of (sub-)Neptunes which displays decreasing density with increasing radius. The interior models for low mass-planets are from Zeng et al. (2019), and the solid black line shows the interior model of H/He dominated giant objects with Z = 0.02, age = 5 Gyr, and no irradiation (Baraffe et al. 2003, 2008).
Current usage metrics show cumulative count of Article Views (full-text article views including HTML views, PDF and ePub downloads, according to the available data) and Abstracts Views on Vision4Press platform.
Data correspond to usage on the plateform after 2015. The current usage metrics is available 48-96 hours after online publication and is updated daily on week days.
Initial download of the metrics may take a while.