Fig. A.7
Download original image
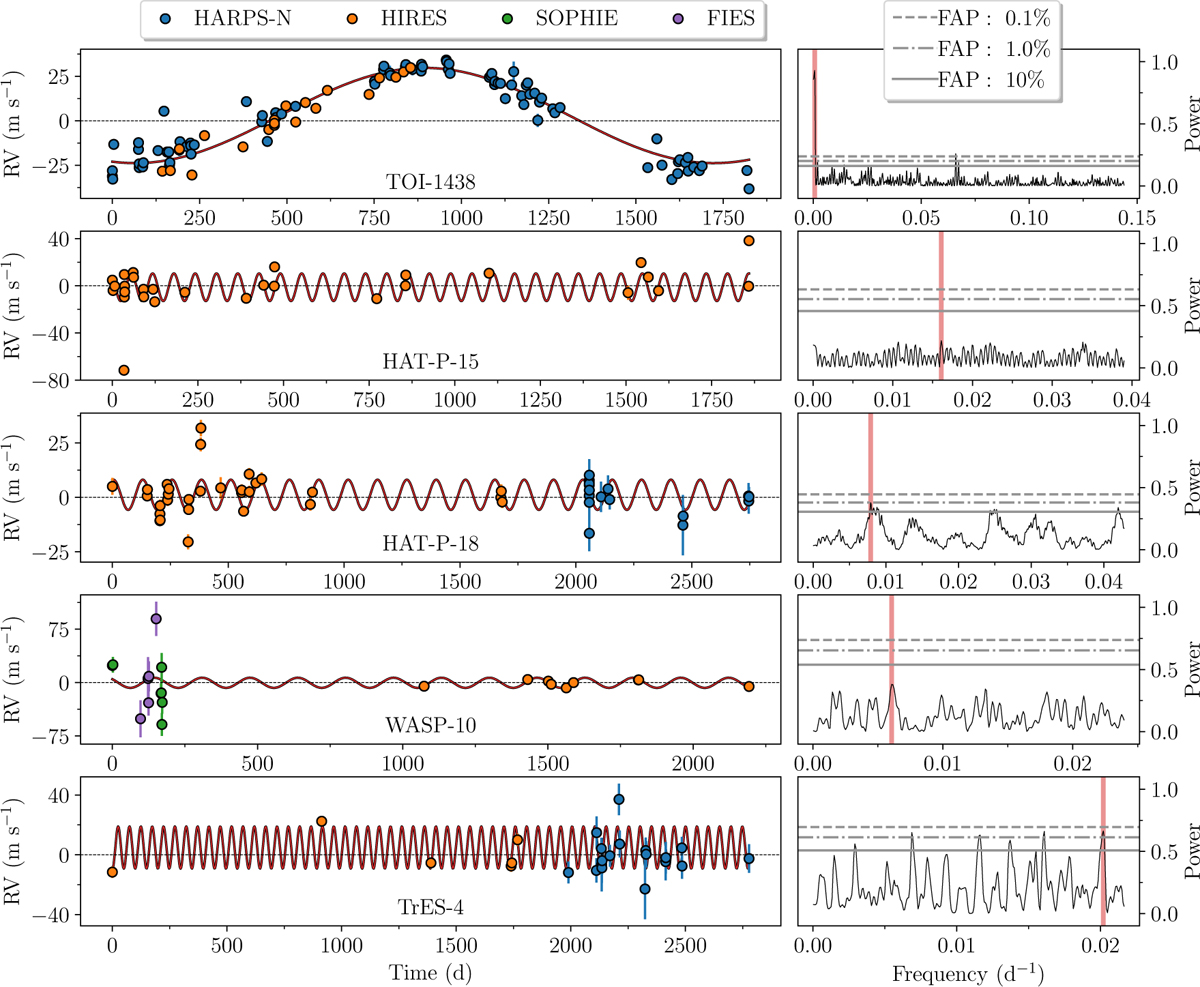
RV residuals for TOI-1438 and the four systems highlighted in Fig. 14 are shown in the plots to the left. The sinusoid shown in red in each of these is calculated from the most prominent peak highlighted in red in the associated GLS to the right. The false alarm probabilities are shown as horizontal lines, with values indicated in the legend.
Current usage metrics show cumulative count of Article Views (full-text article views including HTML views, PDF and ePub downloads, according to the available data) and Abstracts Views on Vision4Press platform.
Data correspond to usage on the plateform after 2015. The current usage metrics is available 48-96 hours after online publication and is updated daily on week days.
Initial download of the metrics may take a while.