Fig. 3
Download original image
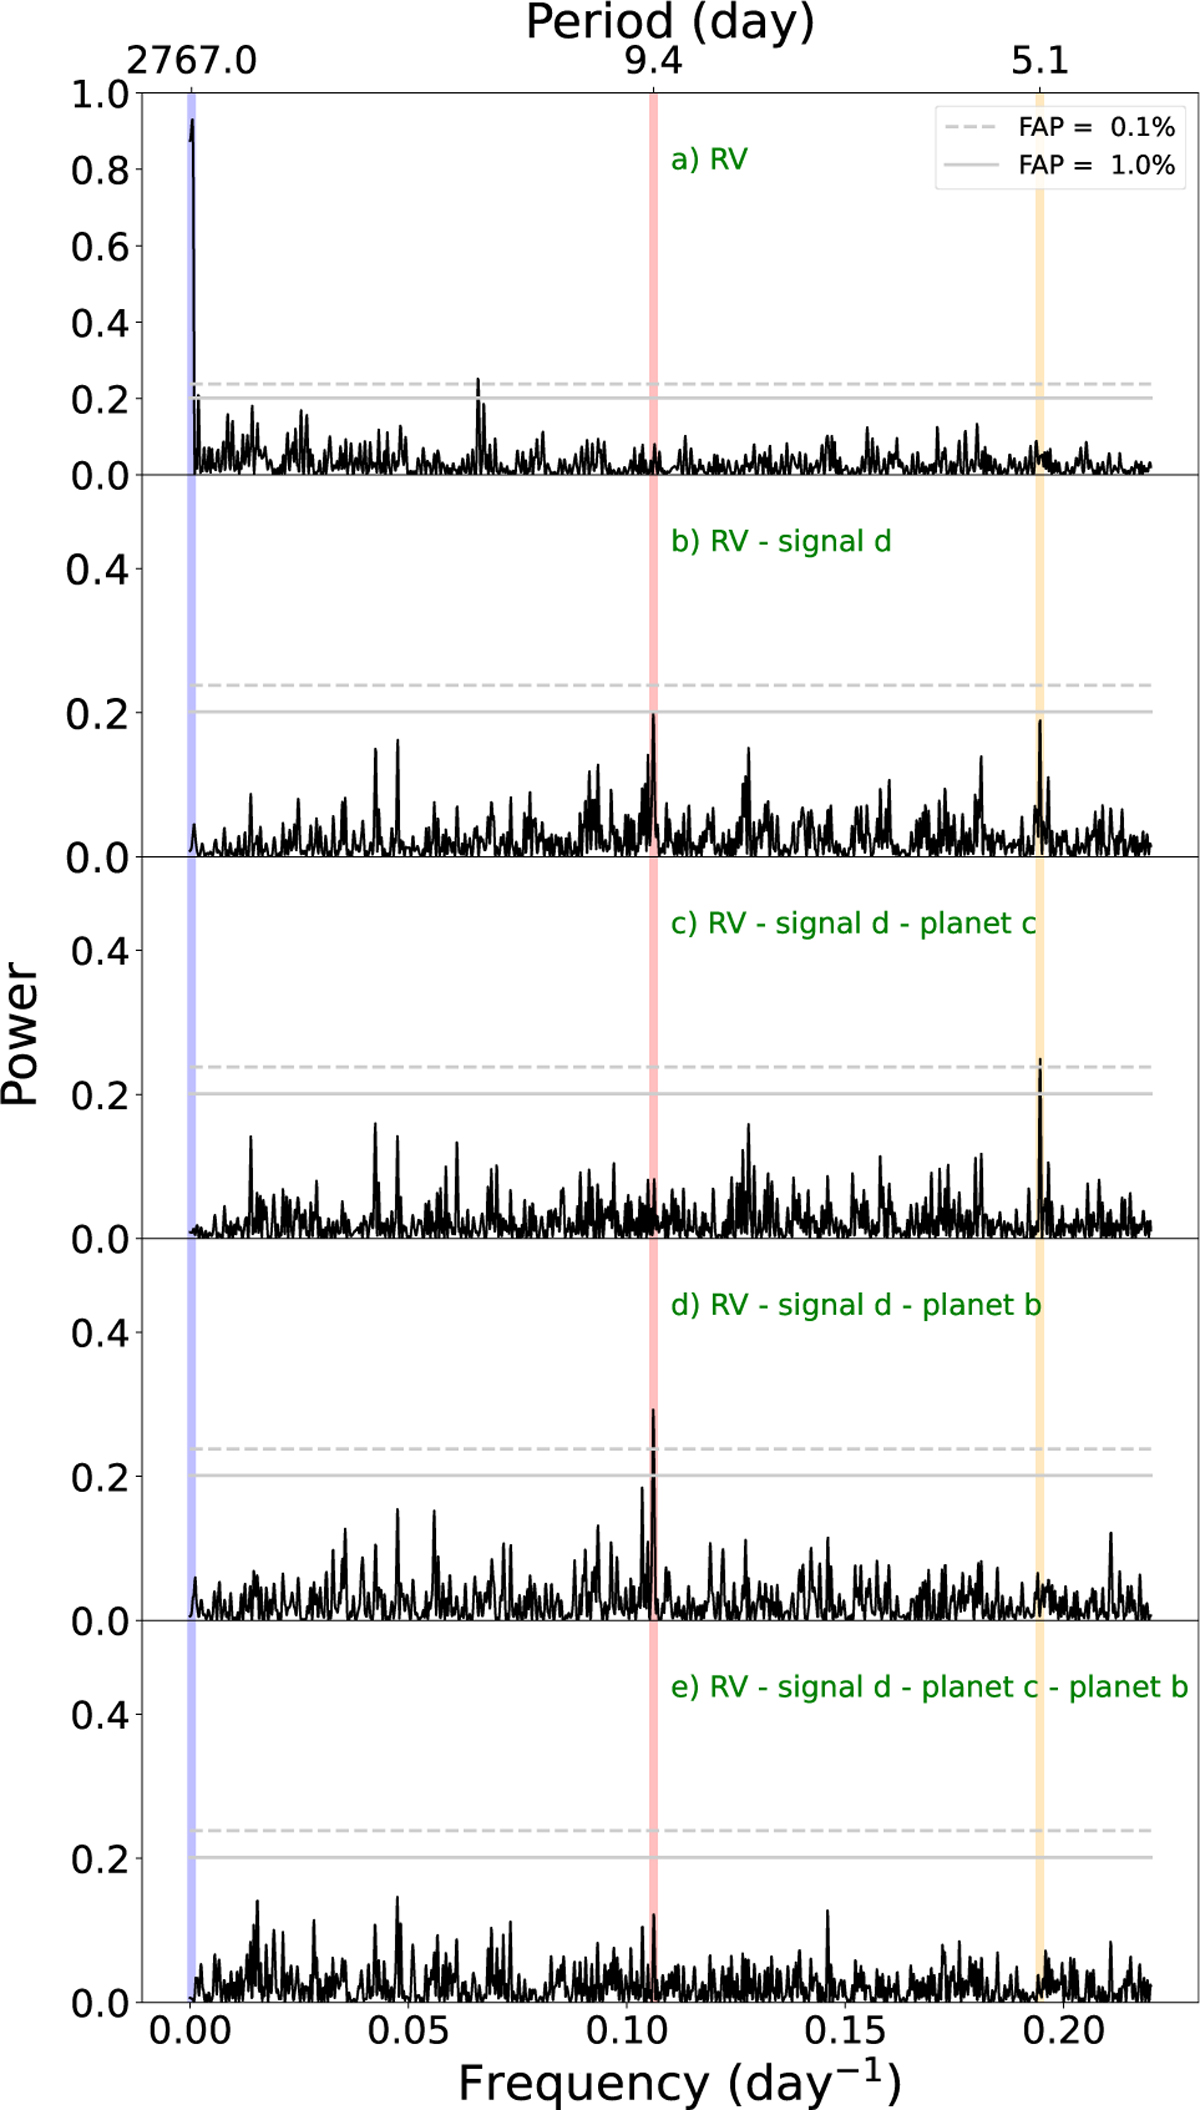
GLS periodogram of the HARPS-N and HIRES RV data. The GLS of the raw RVs are shown in the top panel and the below panels have the best-fitting models subtracted for a given planet or signal d, as described in Sect. 3.4. From right to left, the orange, red, and blue vertical lines denotes the orbital periods of planets b and c, and signal d, respectively.
Current usage metrics show cumulative count of Article Views (full-text article views including HTML views, PDF and ePub downloads, according to the available data) and Abstracts Views on Vision4Press platform.
Data correspond to usage on the plateform after 2015. The current usage metrics is available 48-96 hours after online publication and is updated daily on week days.
Initial download of the metrics may take a while.