Fig.7
Download original image
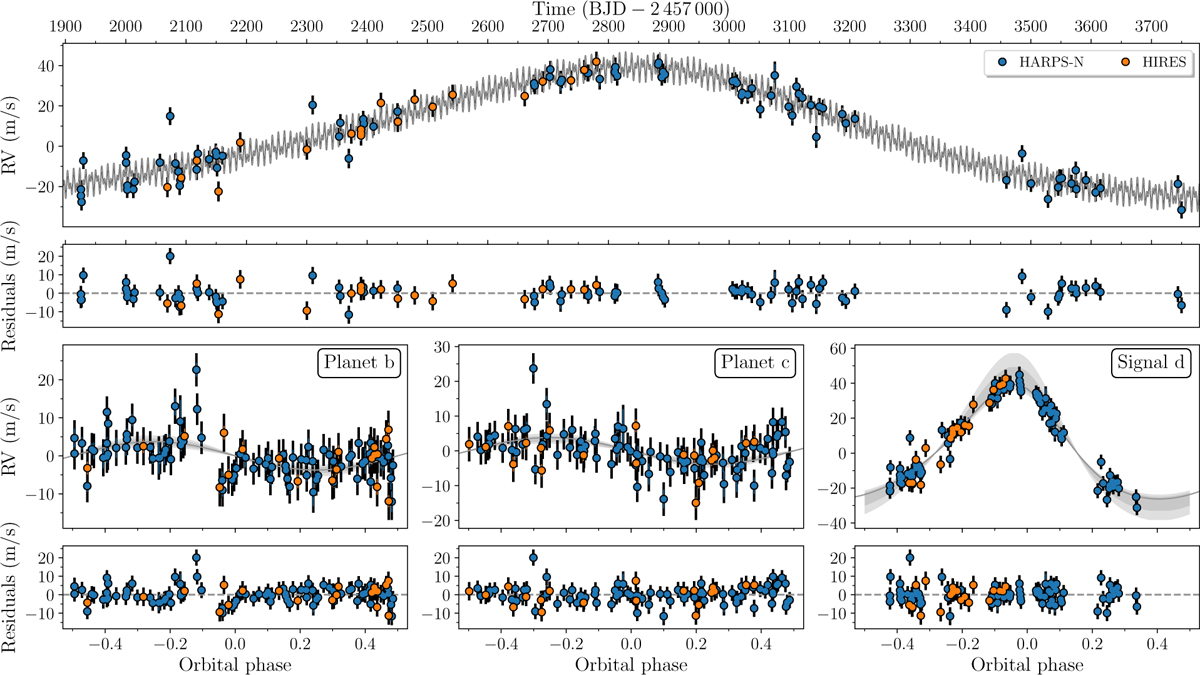
RVs of TOI-1438. Top: the HARPS-N (blue) and HIRES (orange) RV time series with the best-fitting three Keplerian model in grey with residuals shown in the panel below. Lower: the phasefolded RV curves for planet b (left) and c (middle) as well as signal d (right). The best-fitting models are shown as the grey lines with the shaded area denoting the 1 and 2 σ intervals in the K-amplitude. Residuals are given below.
Current usage metrics show cumulative count of Article Views (full-text article views including HTML views, PDF and ePub downloads, according to the available data) and Abstracts Views on Vision4Press platform.
Data correspond to usage on the plateform after 2015. The current usage metrics is available 48-96 hours after online publication and is updated daily on week days.
Initial download of the metrics may take a while.