Fig. 8
Download original image
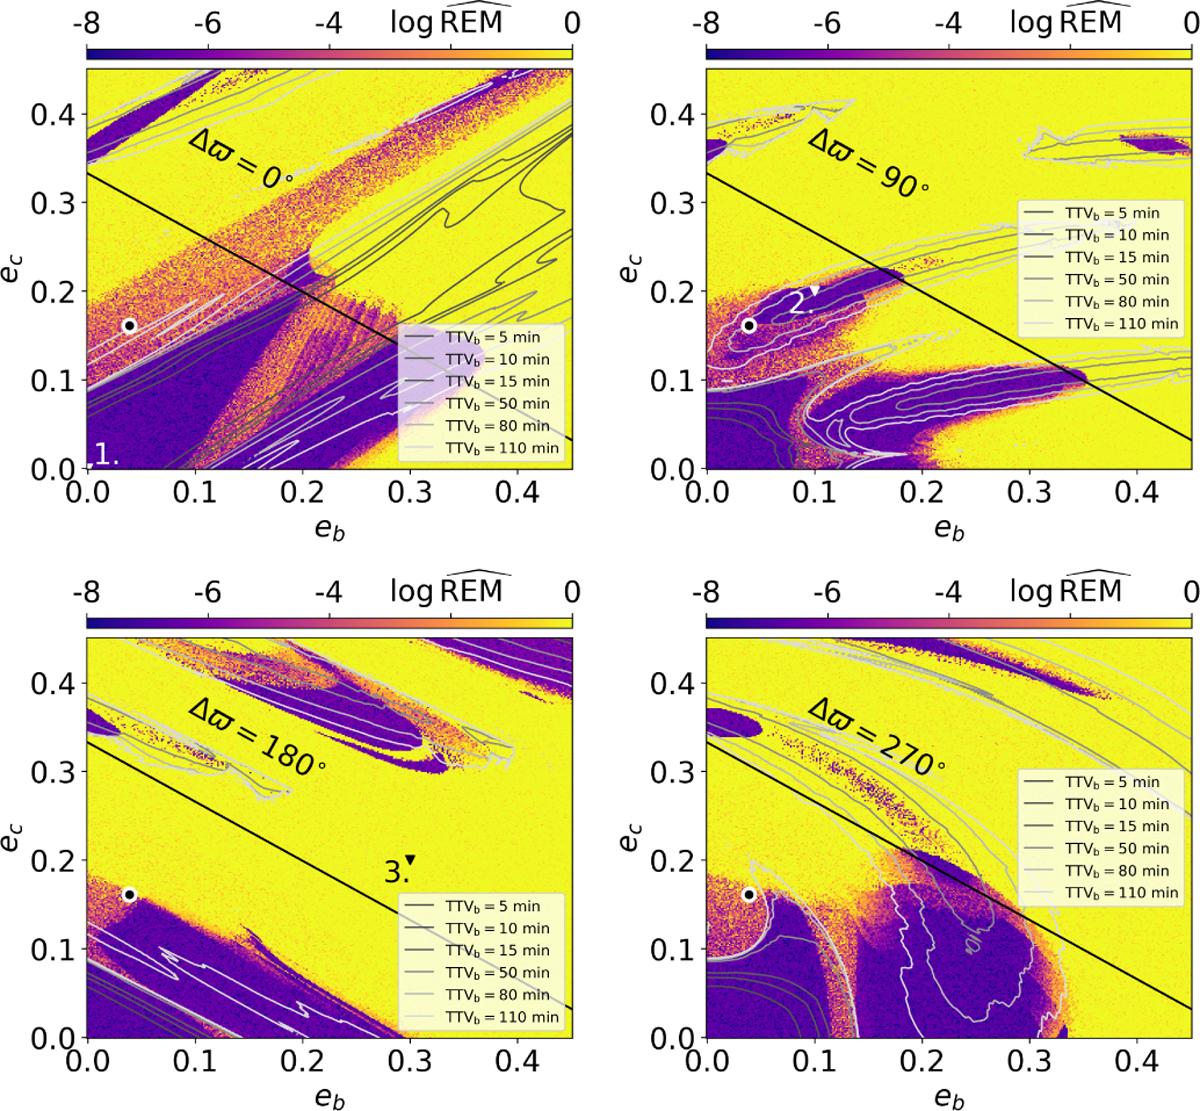
Dynamical maps of the eccentricities of the two inner planets (eb, ec) and fixed values of the argument of pericentre of TOI-1438 b(∆ϖ = ωc − ωb). The black filled circle with a white rim shows the location of the solution obtained by modelling with the eccentricities set as free parameters. Small values of the fast indicator log REM characterises regular (long-term stable) solutions, which are marked with black and dark blue colour. Chaotic solutions are marked with brighter colours, up to yellow. The black line represents the so-called collision curve of orbits, defined by the condition: αb(1 + eb) = ac(1 − ec). The resolution of each plot is 301 × 301 points. Triangles marked 1-3 correspond to the solutions shown in Fig. 9. Also, the labelled grey contours refer to the TTV amplitudes shown in Fig. 10 (details in Section 3.5).
Current usage metrics show cumulative count of Article Views (full-text article views including HTML views, PDF and ePub downloads, according to the available data) and Abstracts Views on Vision4Press platform.
Data correspond to usage on the plateform after 2015. The current usage metrics is available 48-96 hours after online publication and is updated daily on week days.
Initial download of the metrics may take a while.