Fig. 6.
Download original image
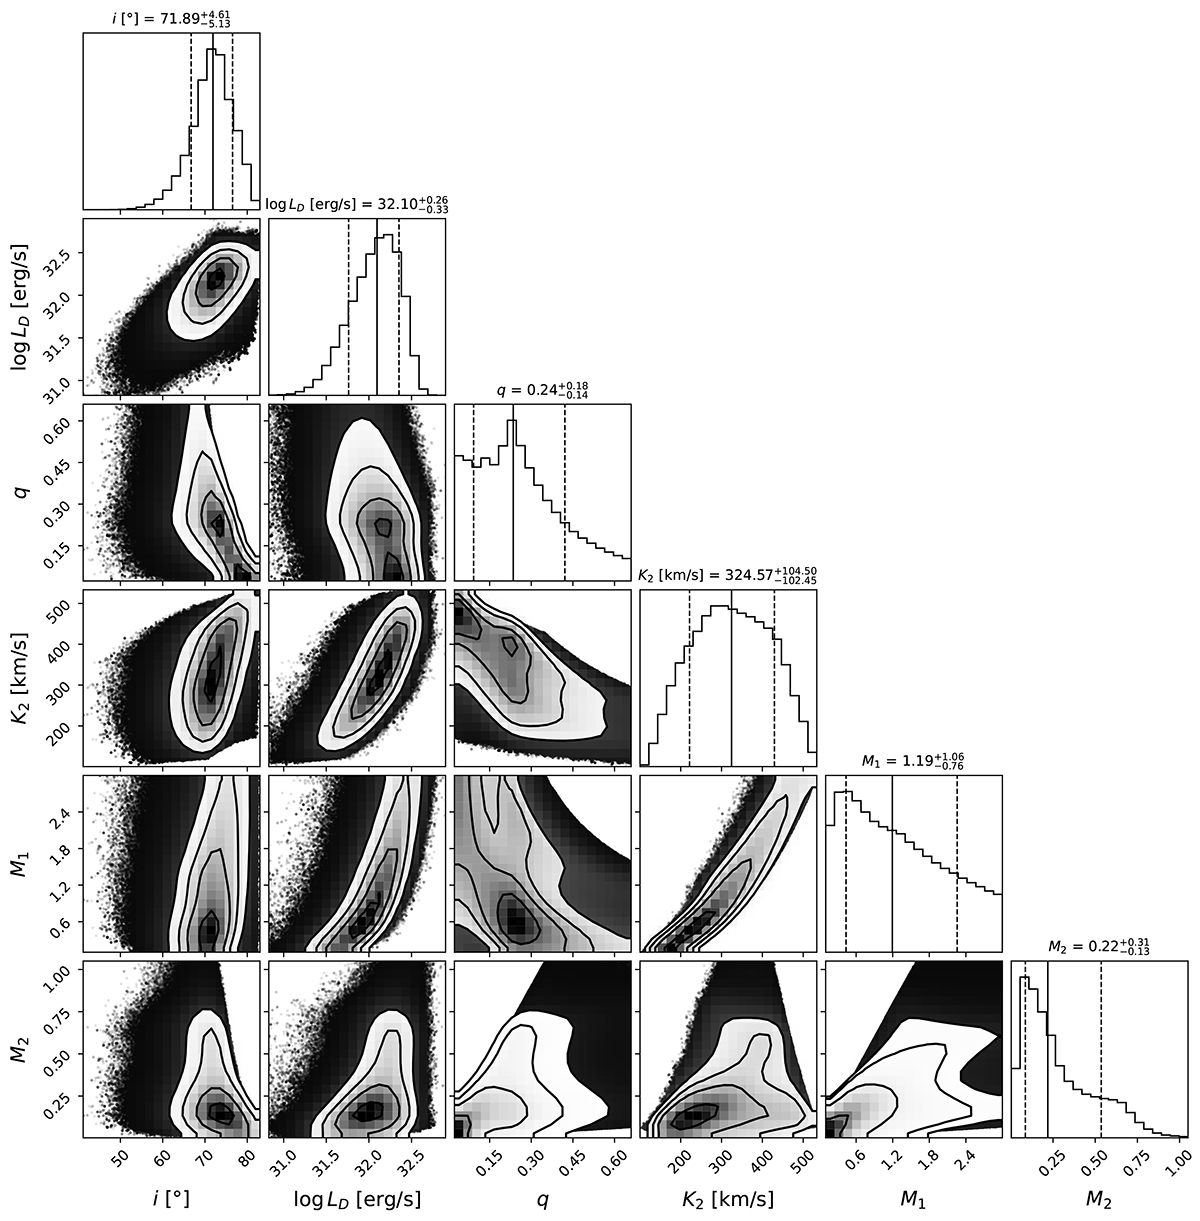
Correlation diagrams showing the probability distributions of the best-fit parameters from the MCMC modelling of the ellipsoidal light curve. The 2D plots display contours corresponding to the 68%, 95%, and 99.7% confidence regions. Rightmost panels: Projected 1D distributions of the parameters, with the median indicated by a solid line and the 68% confidence intervals marked by dashed lines. The value of K2 is inferred from q, MNS, P, and i, whereas the value of M2 is inferred from q and MNS.
Current usage metrics show cumulative count of Article Views (full-text article views including HTML views, PDF and ePub downloads, according to the available data) and Abstracts Views on Vision4Press platform.
Data correspond to usage on the plateform after 2015. The current usage metrics is available 48-96 hours after online publication and is updated daily on week days.
Initial download of the metrics may take a while.