| Issue |
A&A
Volume 702, October 2025
|
|
|---|---|---|
| Article Number | A103 | |
| Number of page(s) | 8 | |
| Section | Stellar structure and evolution | |
| DOI | https://doi.org/10.1051/0004-6361/202555321 | |
| Published online | 10 October 2025 | |
The orbital period and inclination of the neutron star X-ray transient MAXI J1807+132
1
Instituto de Astrofísica de Canarias (IAC), Vía Láctea, La Laguna, E-38205 Santa Cruz de Tenerife, Spain
2
Departamento de Astrofísica, Universidad de La Laguna, E-38206 Santa Cruz de Tenerife, Spain
3
New York University Abu Dhabi, PO Box 129188 Abu Dhabi, UAE
4
Center for Astrophysics and Space Science (CASS), New York University Abu Dhabi, PO Box 129188 Abu Dhabi, UAE
⋆ Corresponding author: This email address is being protected from spambots. You need JavaScript enabled to view it.
Received:
28
April 2025
Accepted:
27
August 2025
Abstract
The neutron star X-ray transient MAXI J1807+132 underwent outbursts in 2017, 2019, and 2023. We conducted an R-band time series photometry campaign using the Isaac Newton Telescope during the 2022 quiescent state. We detected a periodic variation in the light curve that is consistent with ellipsoidal modulation, which allowed us to determine an orbital period of Porb = 4.258 ± 0.008 h. By modelling the light curve, we obtained a binary inclination of i = 72 ± 5 deg and a mass ratio q = 0.24+0.19−0.14 (68% confidence level). Furthermore, our analysis indicates the presence of an early M-dwarf companion that contributes between 30 and 50% to the total flux in the R band. We have extended the previously established absolute magnitude versus orbital period correlation for black hole X-ray transients to neutron star systems. We applied the correlation to MAXI J1807+132, estimating its distance to be 6.3 ± 0.7 kpc and its height above the Galactic plane to be 1.6 ± 0.2 kpc.
Key words: binaries: general / stars: neutron
© The Authors 2025
 Open Access article, published by EDP Sciences, under the terms of the Creative Commons Attribution License (https://creativecommons.org/licenses/by/4.0), which permits unrestricted use, distribution, and reproduction in any medium, provided the original work is properly cited.
This article is published in open access under the Subscribe to Open model. This email address is being protected from spambots. You need JavaScript enabled to view it. to support open access publication.
1. Introduction
In low-mass X-ray binaries (LMXBs), a compact object – either a stellar-mass black hole (BH) or a neutron star (NS) – accretes material from a low-mass donor star through Roche lobe overflow. The transferred material forms an accretion disc, where viscous forces govern angular momentum transport (Shakura & Sunyaev 1973). These systems exhibit two distinct accretion regimes: persistent LMXBs, distinguished by steady and high X-ray luminosities (LX ≳ 1035 erg s−1), and transient LMXBs (X-ray transients). The latter alternate between prolonged quiescent states (LX ≲ 1033 erg s−1; see e.g. Armas Padilla et al. 2013) and episodic outbursts, during which their luminosity increases to the level of persistent systems. X-ray transients (XRTs) are typically discovered during outbursts, which are triggered when thermal-viscous instabilities in the disc amplify mass accretion rates to Ṁ ∼ 10−9 − 10−7 M⊙ yr−1 (Lasota 2001). These events are marked by a sudden rise in luminosity (ΔL ∼ 103 − 107 erg s−1). Outbursts can last from a few weeks to several months (Corral-Santana et al. 2016; Heinke et al. 2025), providing a unique opportunity to study accretion and ejection processes (see e.g. Fender & Muñoz-Darias 2016). The outburst demise is marked by a drop in the mass accretion rate to ≲10−11 M⊙ yr−1, which causes the system to return to quiescence. In this state, the companion star often accounts for a significant fraction of the infrared and optical emission, although the accretion disc can also make a significant contribution. This is the best scenario for dynamical studies since the fundamental parameters of the binary can be determined, including the compact object mass (see e.g. Casares et al. 2017, for a review).
The XRT MAXI J1807+132 (hereafter J1807) was first detected during an outburst in 2017 (Shidatsu et al. 2017; Jiménez-Ibarra et al. 2019) and subsequently experienced two additional events, in 2019 (Albayati et al. 2021) and 2023 (Illiano et al. 2023; Rout et al. 2025). NICER observations during the 2019 outburst detected three type I X-ray bursts, confirming the presence of a NS in J1807 (Albayati et al. 2021). Although these bursts were not of the photospheric radius expansion type, they enabled an upper limit to the distance of 12.4 kpc to be established.
In this paper we present time-resolved R-band photometry of J1807 obtained during quiescence over three nights. With these data, we determined the orbital period of the system and modelled the ellipsoidal light curve to infer the binary parameters. We also estimated its distance and elevation above the Galactic plane.
2. Observations and data reduction
We conducted R-band photometry of J1807 during quiescence, with the 2.5 m Isaac Newton Telescope (INT) at the Roque de los Muchachos Observatory in La Palma, Spain. Observations were carried out on the nights of 24−25 June 2022, and 28 July 2022 (all dates throughout the text are given in UTC). We employed chip 4 of the Wide-Field Camera (WFC), an instrument equipped with four EEV 2048 × 4096 pixel CCDs with a plate scale of 0.33 arcsec pix−1. We acquired a total of 86 images, each with an exposure time of 600 seconds, using the Harris R-band filter. The total observation time was approximately 6.66 hours (40 images), 6 hours (36 images), and 2.33 hours (10 images) on the first, second, and third nights, respectively. The imagequality conditions ranged from 1.25 to 1.75 arcsec on the first two nights, and from 1.5 to 2 arcsec on the third night.
The data reduction and photometry were performed with the HiPERCAM4 pipeline1, with apertures centred on J1807 and five nearby field stars, as shown in Fig. 1. Owing to the faintness of the source, we applied optimal photometry, which weighted the flux of each pixel according to its expected contribution to the total signal relative to the noise (Naylor 1998).
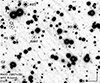 |
Fig. 1. 600 s R-band image of J1807 in quiescence, obtained with the WFC on the night of 24 June 2022. The target (J1807), the reference star (R), and comparison stars are marked with circles. North is at the top, and east is to the left. |
The differential photometry was calibrated using the GSC 2.2 catalogue (Lasker et al. 2021), with stars labelled R1, R2, and R3 in Fig. 1 as reference stars. We confirmed the stability of these three star by comparative analysis with neighbouring field stars, before extracting the light curve for J1807 and comparison stars (C1 and C2), shown in Fig. 2. We quantified the variability using the differential magnitude, Δmr, calculated relative to the average quiescent level ⟨Rq⟩ as ΔmR = R(t)−⟨Rq⟩, where R(t) is the instantaneous R-band magnitude. The photometric analysis yielded mean R magnitudes and associated RMS variabilities of 21.48 ± 0.08 for J1807, 21.18 ± 0.02 for star C1, and 19.18 ± 0.01 for star C2.
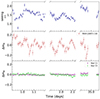 |
Fig. 2. Light curves obtained on 23−24 June 2022 and 27 July 2022. The time is in units of days since HJD 2459754.5. Upper panel: Seeing conditions for each observation. Middle panel: Light curve of J1807. Lower panel: Light curve of the comparison stars marked in Fig. 1, demonstrating photometric stability. |
The Pan-STARRS Data Release 2 (DR2) catalogue (Chambers et al. 2016) provides pre-discovery magnitudes. To estimate the deepest quiescent brightness, we took the faintest minimum values in the r and i bands: r = 21.65 ± 0.20 mag and i = 21.48 ± 0.20 mag. Applying the transformation from Lupton (2005)2: R = r − 0.2936(r − i)−0.1439, we obtained R = 21.46 ± 0.15 mag. This is consistent with our measured value, supporting the conclusion that J1807 was in a deep quiescent state during our observations.
In order to quantify the possible influence of seeing variations on the photometry, we computed the Pearson linear correlation coefficient, r, between the seeing and the differential R-band magnitude for each individual night. This yielded r = 0.04 (p = 0.73), r = −0.12 (p = 0.42), and r = −0.07 (p = 0.84) for 24 June, 25 June, and 28 July, respectively. Thus, in all cases we obtained |r|< 0.2, with the associated p-values far exceeding the conventional significance threshold of 0.05. This indicates that there is no statistically significant correlation between the seeing and the measured flux. We therefore conclude that the observed variability is intrinsic to J1807 and not an artefact due to variable atmospheric conditions.
3. Analysis and results
3.1. Searching for periodicities
The light curve of J1807 exhibits significant variability, featuring apparently periodic maxima and minima, particularly during the first two nights. In order to minimise one-day aliasing and avoid the third night, we first computed the Lomb-Scargle periodogram using only the 25−26 June data. In the 0.005 − 20 d−1 range this two-night analysis reveals a prominent peak at f0 = 11.27 d−1 (2.129 h; see Fig. 3). The sampling window – obtained by applying Lomb-Scargle to a unit-flux series sampled at the same timestamps – shows the expected daily sidelobes at f0 ± 1, 2 d−1; these aliases are indicated by grey dotted ticks at the top of Fig. 3 and do not overlap the principal peak.
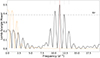 |
Fig. 3. Lomb-Scargle periodogram of the J1807 light curve for the nights of 24−25 June. The Lomb-Scargle power of the signal is in black, and the window function in orange. The red vertical line marks the main peak at 2.129 hours; dotted grey ticks at the top indicate the daily aliases (±1, ±2 d−1). The period has a significance greater than 4σ. |
To assess the significance of the detected frequencies, we computed the false-alarm probability using the astropy routines (Astropy Collaboration 2022). The three strongest peaks all lie above the 4σ threshold under the assumption of white Gaussian noise. However, this criterion ignores the possibility of a red-noise component. In fact, after subtracting a sinusoidal model at f0, we found that the residual power spectrum follows P(f)∝fα with α = −0.09 ± 0.03, indicating mild red noise. To quantify the potential contribution of correlated noise, we generated 105 synthetic light curves – each built by adding a sinusoid at f0 to 1/fα noise produced with the Timmer & König (1995) algorithm – sampled at the same cadence. We recomputed the Lomb-Scargle periodogram for each realisation and recorded the power at f0; none of the trials reached the observed value, yielding a p-value < 10−5 and confirming that the f0 peak remains significant even in the presence of red noise.
The primary peak was fitted by a Gaussian; therefore, we adopted the mean and standard deviation as the representative value and the 1σ uncertainty, respectively. We preliminarily determined the period to be 2.129 ± 0.004 hours. Recomputing the periodogram with the third night included produces a consistent Gaussian fit within the uncertainties, confirming the robustness of this period estimate.
We independently folded the light curve for each night, testing two periods: the 2.129 h value derived from Lomb-Scargle analysis, and twice this value, 4.258 h. Folding with the 2.129 h period yielded a light curve displaying single-hump modulation, although the minimum depth showed considerable variation from cycle to cycle. Using the 4.258 h period for folding, however, resulted in a double-humped light curve, which exhibited two minima of unequal depth. This morphology is characteristic of the ellipsoidal modulation expected in quiescence. The gravitational interaction with the NS distorts the companion, and as it orbits, the changing projected area of its ellipsoidal form produces two maxima and two minima per orbital cycle (see e.g. Kopal 1954; Beech 1989; Wilson 1972; Avni & Bahcall 1975). The deepest minimum is expected to occur at superior conjunction of the companion (orbital phase 0.5) due to the stronger gravitational darkening around the inner Lagrangian point. This minimum was calculated to occur at T0.5(HJD) = 2459755.572 ± 0.002 (at 1σ confidence interval). We then used this epoch to calculate the phases of minima in the other light curves. These were separated by integer multiples of the period and consistently aligned in phase, as shown in Fig. 4.
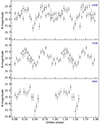 |
Fig. 4. Phase-folded light curves on the 4.258 h of J1807. The reference epoch used was T0.5(HJD) = 2459755.572. The observation dates are given in the upper right of each panel. |
The phase-folded light curves from the first and second nights consistently show two minima within the error margins, with one being deeper than the other. We conclude that the period of 4.258 ± 0.008 h represents the orbital period of the system. This determination is based on the consistent features of the light curve, which exhibit characteristic ellipsoidal modulation, including the stable phase alignment of the primary minimum across multiple datasets.
3.2. Light curve modelling
Ellipsoidal modulations in quiescent XRTs can be contaminated by aperiodic variability (flickering) of unknown origin (e.g. Zurita et al. 2003). To better capture the shape of the modulation in J1807, we grouped the data into orbital phase bins and calculated the weighted median and weighted median error for each bin. Given the variability between nights, using the median allowed us to reduce the impact of outliers. With a phase interval of 0.025 per bin, we found that the characteristic ellipsoidal pattern of the J1807 light curve was accurately represented across the three nights, despite the aperiodic variability present on each individual night.
We used the XRBinary code3 to model the light curve (see e.g., Khargharia et al. 2013; Gomez et al. 2015, 2021; Álvarez-Hernández et al. 2021) and employed the EMCEE sampler for fitting (Foreman-Mackey et al. 2013). The code computed synthetic light curves of a binary system where a compact primary is accompanied by a co-rotating companion that fills its Roche lobe. The model accounts for the tidal distortion of the companion, which produces ellipsoidal variations, and includes the presence of an optically thick accretion disc that emits as a multi-temperature blackbody. The main parameters that determine the XRBinary synthetic light curve are the binary inclination (i), the orbital period (Porb), the mass ratio (q), the NS mass (M1), the companion’s effective temperature (T2), and the bolometric luminosity of the disc (Ld). The flux spectrum of the donor star was derived from the stellar atmosphere models of Kurucz (1996), using a non-linear limb darkening formulation from Claret (2000a), which is valid for surface gravities in the range 0.0 ≤ log g ≤ 5.0 dex and effective temperatures of 3500 − 8000 K. The gravitational darkening depends only on the effective temperature of the star, following the formulation in Claret (2000b).
The model in the XRBinary code adopts a cylindrically symmetric disc, with a height profile described by
 (1)
(1)
where rin and Rd represent the inner and outer radii of the disc, Hd denotes the semi-height at the disc’s outer edge, and n is the exponent that governs the height profile. In our model, Rd is constrained to be equal to the circularisation radius:
 (2)
(2)
where b1 is the distance from the primary star to the inner Lagrangian point, given by Warner (1995). We also evaluated models with the disc reaching the tidal radius (Whitehurst & King 1991) and found no significant differences in the final results with respect to those using the circularisation radius.
The temperature profile of the disc was set to that of a steady-state, optically thick, viscous disc:
 (3)
(3)
Here, the normalisation constant K ensures that the temperature distribution matches the bolometric luminosity Ld of the disc, and r is the distance to the primary star. We also investigated a power-law temperature profile (i.e. T ∝ r−β, where β = 3/4 corresponds to the asymptotic behaviour of a standard viscous disc) and found consistent results within a 1σ. The disc parameters, such as Hd, rin, and n, were fixed following van Grunsven et al. (2017) and Mata Sánchez et al. (2021). The light curve was symmetric with consistent maxima; therefore, hot spots did not need to be considered, neither on the companion nor in the accretion disc. The full list of model parameters can be found in Table 1.
We sampled the parameter space within physically reasonable ranges. The orbital period was constrained with a Gaussian prior with mean and standard deviation 4.26 ± 0.01 hours, while for the inclination (i) we adopted a uniform prior in cos(i) spanning 30−90 deg (assuming randomly oriented orbits). The disc luminosity (Ld) was sampled using a logarithmically flat prior, with log(Ld) allowed to vary between 30 and 35. Given that the binary system is composed of a NS and a low-mass companion, we constrained the mass ratio and NS mass using priors of 0.02−0.7 and < 3 M⊙, respectively (see e.g. Muñoz-Darias et al. 2005; Casares 2016).
We can constrain T2 since Roche-lobe-filling companion stars in LMXBs with orbital periods ≲7 − 8 h are consistent with main-sequence or slightly evolved stars (Smith & Dhillon 1998; see also Casares et al. 2025). For a Roche-lobe-filling companion star, the orbital period provides an estimate of the mean stellar density via the relation  g cm−3, where Porb is expressed in hours (Faulkner 1971). Our orbital period yields ⟨ρ⟩=6.06 g cm−3, consistent with an M1 dwarf (Drilling & Landolt 2000). This motivates fixing T2 to the effective temperature of the expected spectral type (Teff = 3660 K; Pecaut & Mamajek 2013). To evaluate systematic uncertainties, we tested Teff at 3500 K (the lower bound of our parameter range) and 4000 K. The orbital inclination varied by only 2−4°, demonstrating minimal sensitivity to Teff assumptions. Additionally, we fixed the donor star’s albedo value of 0.5, although varying this parameter has no significant effect on the synthetic light curve.
We ran the Markov chain Monte Carlo (MCMC) sampler for 80 000 steps with 136 walkers, discarding the first 20% of the steps as burn-in. An inspection of the MCMC chains confirmed that each parameter converged properly. The resulting model parameters, along with their uncertainties at the 68% confidence interval, are summarised in Table 1. These values were derived from the marginalised posteriors (i.e. the 16th, 50th, and 84th percentiles), and the resulting probability distributions are shown in Fig. 6. From the posterior distributions of our MCMC analysis, we randomly drew combinations of parameters to generate a set of synthetic light curves. We present these in Fig. 5 to allow readers to visually assess the quality of the resulting fits. The best-fit model provides a χ2 = 79.6 for 67 degrees of freedom (χred2 = 1.19). Our modelling reveals an inclination of 72 ± 5 deg and a bolometric luminosity of the accretion disc of log(Ld) = 32.1 ± 0.3 erg s−1. The mass ratio and NS massdistributions yield  and
and  (68% confidence level), respectively. To determine the companion contribution to the total flux in the R band, we analysed its complete posterior distribution from our synthetic light curves. We constructed histograms from the values obtained in each realisation, extracting the central value and corresponding 1σ uncertainty. The companion star contributes 42 ± 9% to the total flux.
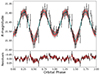 |
Fig. 5. Light curve modelling. Upper panel: J1807 data (black dots) and the synthetic light curves based on the 68% confidence intervals from the MCMC analysis (red lines). The teal line indicates the best-fit model. Lower panel: Residuals from the best-fit model (black dots) and for each individual synthetic light curve (red lines). |
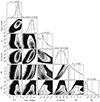 |
Fig. 6. Correlation diagrams showing the probability distributions of the best-fit parameters from the MCMC modelling of the ellipsoidal light curve. The 2D plots display contours corresponding to the 68%, 95%, and 99.7% confidence regions. Rightmost panels: Projected 1D distributions of the parameters, with the median indicated by a solid line and the 68% confidence intervals marked by dashed lines. The value of K2 is inferred from q, MNS, P, and i, whereas the value of M2 is inferred from q and MNS. |
Fixed and best-fit parameters for the R-band light-curve model.
4. Discussion
We analysed photometric data of J1807 collected over three nights during its quiescent state. We detected a significant periodicity of 2.129 ± 0.004 hours in the light curves. After folding the data at twice the detected periodicity, we observed two distinct minima, with one being noticeably deeper than the other. Assuming that the deeper minima occurred at orbital phase 0.5 each night, the light curve morphology is consistent with an ellipsoidal modulation. Therefore, we conclude that the orbital period is Porb = 4.258 ± 0.008 hours. Other NS-XRTs with similar orbital periods include XTE J2123−058 (K2 = 287 ± 12 km s−1, Porb = 5.95 h, i = 69 − 77 deg, q = 0.49 ± 0.10; Casares et al. 2002; Shahbaz et al. 2003) and EXO 0748−676 (K2 ≳ 300 km s−1, Porb = 3.82 h, i = 75 − 82 deg, q = 0.11 − 0.28; Muñoz-Darias et al. 2009). The phase-resolved R-band light curve of J1807 exhibits a peak-to-peak amplitude of ∼0.2 mag. The light curve shows short-timescale stochastic variations (∼0.1 mag amplitude), typically referred to as flickering – a characteristic signature of mass accretion processes. The relatively low amplitude of these variations suggests significant flux contribution from the companion star, which our light curve modelling quantifies at 42 ± 9% of the observed flux. Pre-discovery (i.e. HJD 2455718.4052) Pan-STARRS DR2 photometry (Chambers et al. 2016) shows significantly larger variability amplitudes of ∼0.9 mag and ∼1.7 mag in the i and r bands, respectively. This variability can be associated with either more intense flickering events or variations in the long-term brightness of the system (see e.g. Cantrell et al. 2008).
4.1. Constraints on the binary parameters
Our light curve modelling analysis (Sect. 3.2) constrains the orbital inclination to 72 ± 5 deg. The mass ratio and NS mass are loosely constrained. Using the median and 68% confidence intervals from the posterior distribution (Fig. 6), we obtained  and
and  (68% conf. level). From these distributions, we derived a companion star mass of
  . This broad M2 range encompasses an M-type companion scenario. Our light curve modelling adopts Teff = 3660 K (M1V spectral type, Pecaut & Mamajek 2013).
We determined the companion-star radial-velocity semi–amplitude (K2) using the orbital period together with the posterior distributions of the mass ratio (q), the NS mass (MNS), and the inclination (i) via the mass function
 (4)
(4)
finding K2 = 325 ± 105 km s−1. Similarly, our modelling yields a NS radial velocity semi-amplitude of  km s−1. Notably, the Hα line profile centroid measured across six epochs (five outbursts and one quiescent; see Table 3 in Jiménez-Ibarra et al. 2019) displays a maximum variation of 63 ± 35 km s−1, consistent with our K1 constraint and suggesting that this disc’s emission line broadly tracks the NS motion.
4.2. Distance and Galactic elevation
The quiescent r-band magnitude and orbital period can constrain the distance to J1807 through the Mr − Porb correlation, originally developed for BH-XRTs (Casares 2018). As demonstrated in the appendix, this correlation likely applies equally to NS-XRTs. The empirical relation is
 (5)
(5)
With the faintest Pan-STARRS DR2 pre-outburst magnitude, r = 21.65 ± 0.20 and Porb = 0.1774 ± 0.0003 days, we derived an absolute magnitude of Mr = 7.4 ± 0.2. The distance to J1807 follows from the distance modulus:
![Mathematical equation: $$ \begin{aligned} d\,(\mathrm{kpc}) = 10^{[0.2 (r - M_r - A_r) - 2]}. \end{aligned} $$](/articles/aa/full_html/2025/10/aa55321-25/aa55321-25-eq16.gif) (6)
(6)
Three-dimensional reddening maps, constructed using Pan-STARRS/2MASS photometry and Gaia parallaxes (Green et al. 2019), reveal that interstellar extinction towards J1807 increases up to 0.4 kpc, subsequently stabilising at  . This level of reddening corresponds to an r-band extinction Ar = 2.617 × E(g − r) = 0.26 ± 0.02 mag, implying a distance of 6.3 ± 0.7 kpc.
X-ray spectral analysis provides an independent method for estimating distances. Analysing NICER spectra from the 2023 outburst, Rout et al. (2025) determined an absorption column density of NH = (2.61 ± 0.02)×1021 cm−2, considering non-solar abundances. Using the relationship NH/E(B − V) = 8.3 × 1021 cm−2 mag−1 from Liszt (2014), E(B − V) = 0.3 mag. Assuming a standard Galactic extinction law characterised by RV = 3.1 (Cardelli et al. 1989; Fitzpatrick 1999), we calculated the r-band extinction using the relation provided by Schlafly & Finkbeiner (2011), yielding Ar = 0.71 ± 0.01 mag. This estimate is comparable with an alternative value derived using the NH/AV calibration from Zhu et al. (2017), which gives Ar = 0.67 ± 0.01 mag. Using these extinction estimates, the derived distances are d = 5.06 ± 0.60 kpc and d = 5.17 ± 0.61 kpc, respectively.
The properties of the companion star offer further constraints. J1807 exhibits a quiescent r-band magnitude of 21.65 ± 0.20 mag. Accounting for the companion contribution to the total flux (42 ± 9%), the apparent magnitude of the companion is determined to be 22.59 ± 0.32 mag. Application of the distance modulus using Ar = 0.26 ± 0.02 mag (from the reddening maps) and adopting absolute magnitudes for companion star of Mr * =8.3 (M0V) or Mr * =9.0 (M1V; Pecaut & Mamajek 20134) yields distance estimates of 5.5−7.4 kpc and 3.9−5.2 kpc, respectively. These ranges match the distance predicted by the Mr − Porb correlation, reinforcing the classification of the companion as an early M-type dwarf.
The two primary distance determinations (6.3 ± 0.7 kpc from reddening maps and 5.2 ± 0.4 kpc from the 2023 outburst X-ray fitting) differ only ∼1.7σ. The distance ranges inferred from the companion star properties (3.9−7.4 kpc for M0V–M1V types) overlap with the uncertainty intervals of both primary estimates. In light of this, we decide to adopt as the preferred distance for this study: d = 6.3 ± 0.7 kpc. This corresponds to a 3σ confidence range of 4.8−7.8 kpc. Using this distance and the Galactic latitude of J1807 (b = 15.501 deg), the Galactic height is z = 1.6 ± 0.2 kpc. This places the system significantly above the thin disc (z > 1.1 kpc).
Using the preferred distance and the 2−10 keV maximum fluxes observed for the three outburst events (Shidatsu et al. 2017; Albayati et al. 2021; Heinke et al. 2025), we calculated the peak luminosities. Applying a bolometric correction factor of 2.9 (in’t Zand et al. 2007) and assuming a 1.4 M⊙ NS, we obtain 3 × 1036 erg s−1 (∼0.017 LEdd), 2.6 × 1036 erg s−1 (∼0.015 LEdd), and 3.7 × 1036 erg s−1 (∼0.021 LEdd) for the 2017, 2019, and 2023 outburst, respectively.
5. Conclusions
We determined an orbital period of 4.258 ± 0.008 hours for J1807 by analysing photometric data collected over three nights while the system was in quiescence. The detection of ellipsoidal modulation in the light curve allowed us to conduct the first analysis of the binary parameters, establishing an orbital inclination of 72 ± 5 deg. Additionally, we verified the applicability of the Mr − Porb correlation to NS-XRTs, which enabled us to estimate the distance to J1807 as 6.3 ± 0.7 kpc. This work represents an important step in the characterisation of the dynamical properties of J1807 and lays the groundwork for future spectroscopic studies that will be able to further refine these estimates and obtain the NS mass.
Developed by E. L. Robinson, a detailed description of XRBinary can be found at: http://www.as.utexas.edu/~elr/Robinson/XRbinary.pdf
Acknowledgments
We thank the referee for their thoughtful comments, which substantially enhanced the clarity and robustness of the manuscript. We acknowledge support by Spanish Agencia estatal de investigación via PID2021-124879NB-I00 and PID2022-143331NB-100. M.A.P. acknowledges support through the Ramón y Cajal grant RYC2022-035388-I, funded by MCIU/AEI/10.13039/501100011033 and FSE+. The data were made publically available through the Isaac Newton Group’s Wide Field Camera Survey Programme. The Isaac Newton Telescope is operated on the island of La Palma by the Isaac Newton Group in the Spanish Observatorio del Roque de los Muchachos of the Instituto de Astrofísica de Canarias. The Guide Star Catalogue-II is a joint project of the Space Telescope Science Institute and the Osservatorio Astronomico di Torino. Space Telescope Science Institute is operated by the Association of Universities for Research in Astronomy, for the National Aeronautics and Space Administration under contract NAS5-26555. The participation of the Osservatorio Astronomico di Torino is supported by the Italian Council for Research in Astronomy. Additional support is provided by European Southern Observatory, Space Telescope European Coordinating Facility, the International GEMINI project and the European Space Agency Astrophysics Division.
References
- Albayati, A. C., Altamirano, D., Jaisawal, G. K., et al. 2021, MNRAS, 501, 261 [Google Scholar]
- Álvarez-Hernández, A., Torres, M. A. P., Rodríguez-Gil, P., et al. 2021, MNRAS, 507, 5805 [CrossRef] [Google Scholar]
- Armas Padilla, M., Degenaar, N., Russell, D. M., & Wijnands, R. 2013, MNRAS, 428, 3083 [NASA ADS] [CrossRef] [Google Scholar]
- Astropy Collaboration (Price-Whelan, A. M., et al.) 2022, ApJ, 935, 167 [NASA ADS] [CrossRef] [Google Scholar]
- Avni, Y., & Bahcall, J. N. 1975, ApJ, 197, 675 [NASA ADS] [CrossRef] [Google Scholar]
- Beech, M. 1989, Ap&SS, 152, 329 [Google Scholar]
- Blair, W. P., Raymond, J. C., Dupree, A. K., et al. 1984, ApJ, 278, 270 [Google Scholar]
- Cantrell, A. G., Bailyn, C. D., McClintock, J. E., & Orosz, J. A. 2008, ApJ, 673, L159 [Google Scholar]
- Cardelli, J. A., Clayton, G. C., & Mathis, J. S. 1989, ApJ, 345, 245 [Google Scholar]
- Casares, J. 2016, ApJ, 822, 99 [NASA ADS] [CrossRef] [Google Scholar]
- Casares, J. 2018, MNRAS, 473, 5195 [CrossRef] [Google Scholar]
- Casares, J., Dubus, G., Shahbaz, T., Zurita, C., & Charles, P. A. 2002, MNRAS, 329, 29 [Google Scholar]
- Casares, J., Jonker, P. G., & Israelian, G. 2017, in Handbook of Supernovae, eds. A. W. Alsabti, & P. Murdin, 1499 [Google Scholar]
- Casares, J., Torres, M. A. P., & Navarro Umpiérrez, S. 2025, A&A, 700, A29 [NASA ADS] [CrossRef] [EDP Sciences] [Google Scholar]
- Chambers, K. C., Magnier, E. A., Metcalfe, N., et al. 2016, ArXiv e-prints [arXiv:1612.05560] [Google Scholar]
- Chevalier, C., Ilovaisky, S. A., Leisy, P., & Patat, F. 1999, A&A, 347, L51 [NASA ADS] [Google Scholar]
- Claret, A. 2000a, A&A, 363, 1081 [NASA ADS] [Google Scholar]
- Claret, A. 2000b, A&A, 359, 289 [NASA ADS] [Google Scholar]
- Corral-Santana, J. M., Casares, J., Muñoz-Darias, T., et al. 2016, A&A, 587, A61 [NASA ADS] [CrossRef] [EDP Sciences] [Google Scholar]
- Drilling, J. S., & Landolt, A. U. 2000, in Allen’s Astrophysical Quantities, ed. A. N. Cox, 381 [Google Scholar]
- Faulkner, J. 1971, ApJ, 170, L99 [NASA ADS] [CrossRef] [Google Scholar]
- Fender, R., & Muñoz-Darias, T. 2016, Lect. Notes Phys., 905, 65 [NASA ADS] [CrossRef] [Google Scholar]
- Fitzpatrick, E. L. 1999, PASP, 111, 63 [Google Scholar]
- Foreman-Mackey, D., Hogg, D. W., Lang, D., & Goodman, J. 2013, PASP, 125, 306 [Google Scholar]
- Gaia Collaboration 2020, VizieR Online Data Catalog: I/350 [Google Scholar]
- Gomez, S., Mason, P. A., & Robinson, E. L. 2015, ApJ, 809, 9 [NASA ADS] [CrossRef] [Google Scholar]
- Gomez, S., Torres, M. A. P., Jonker, P. G., et al. 2021, MNRAS, 502, 48 [NASA ADS] [CrossRef] [Google Scholar]
- Green, G. M., Schlafly, E., Zucker, C., Speagle, J. S., & Finkbeiner, D. 2019, ApJ, 887, 93 [NASA ADS] [CrossRef] [Google Scholar]
- Heinke, C. O., Zheng, J., Maccarone, T. J., et al. 2025, ApJS, 279, 57 [Google Scholar]
- Hertz, P., Wood, K. S., & Cominsky, L. R. 1997, ApJ, 486, 1000 [Google Scholar]
- Hynes, R. I., Charles, P. A., Haswell, C. A., et al. 2001, MNRAS, 324, 180 [Google Scholar]
- Illiano, G., Papitto, A., Ambrosino, F., Zanon, A. M., & Sanna, A. 2023, ATel, 16125, 1 [Google Scholar]
- in’t Zand, J. J. M., Jonker, P. G., & Markwardt, C. B. 2007, A&A, 465, 953 [CrossRef] [EDP Sciences] [Google Scholar]
- Jiménez-Ibarra, F., Muñoz-Darias, T., Armas Padilla, M., et al. 2019, MNRAS, 484, 2078 [CrossRef] [Google Scholar]
- Khargharia, J., Froning, C. S., Robinson, E. L., & Gelino, D. M. 2013, AJ, 145, 21 [NASA ADS] [CrossRef] [Google Scholar]
- Kopal, Z. 1954, MNRAS, 114, 101 [NASA ADS] [CrossRef] [Google Scholar]
- Kurucz, R. L. 1996, ASP Conf. Ser., 108, 2 [NASA ADS] [Google Scholar]
- Lasker, B., Lattanzi, M. G., McLean, B. J., et al. 2021, VizieR Online Data Catalog: I/353 [Google Scholar]
- Lasota, J.-P. 2001, New Astron. Rev., 45, 449 [Google Scholar]
- Liszt, H. 2014, ApJ, 780, 10 [Google Scholar]
- Mata Sánchez, D., Muñoz-Darias, T., Casares, J., & Jiménez-Ibarra, F. 2017, MNRAS, 464, L41 [CrossRef] [Google Scholar]
- Mata Sánchez, D., Rau, A., Álvarez Hernández, A., et al. 2021, MNRAS, 506, 581 [CrossRef] [Google Scholar]
- Muñoz-Darias, T., Casares, J., & Martínez-Pais, I. G. 2005, ApJ, 635, 502 [CrossRef] [Google Scholar]
- Muñoz-Darias, T., Casares, J., O’Brien, K., et al. 2009, MNRAS, 394, L136 [NASA ADS] [Google Scholar]
- Naylor, T. 1998, MNRAS, 296, 339 [NASA ADS] [CrossRef] [Google Scholar]
- Parikh, A. S., Degenaar, N., Hernández Santisteban, J. V., et al. 2021, MNRAS, 501, 1453 [Google Scholar]
- Pecaut, M. J., & Mamajek, E. E. 2013, ApJS, 208, 9 [Google Scholar]
- Rout, S. K., Muñoz-Darias, T., Homan, J., et al. 2025, ApJ, 978, 12 [Google Scholar]
- Schlafly, E. F., & Finkbeiner, D. P. 2011, ApJ, 737, 103 [Google Scholar]
- Shahbaz, T., Naylor, T., & Charles, P. A. 1993, MNRAS, 265, 655 [Google Scholar]
- Shahbaz, T., Zurita, C., Casares, J., et al. 2003, ApJ, 585, 443 [NASA ADS] [CrossRef] [Google Scholar]
- Shakura, N. I., & Sunyaev, R. A. 1973, A&A, 24, 337 [NASA ADS] [Google Scholar]
- Shidatsu, M., Tachibana, Y., Yoshii, T., et al. 2017, ApJ, 850, 155 [Google Scholar]
- Smith, D. A., & Dhillon, V. S. 1998, MNRAS, 301, 767 [NASA ADS] [CrossRef] [Google Scholar]
- Timmer, J., & König, M. 1995, A&A, 300, 707 [Google Scholar]
- Tomsick, J. A., Heindl, W. A., Chakrabarty, D., & Kaaret, P. 2002, ApJ, 581, 570 [Google Scholar]
- Tomsick, J. A., Gelino, D. M., Halpern, J. P., & Kaaret, P. 2004, ApJ, 610, 933 [Google Scholar]
- Torres, M. A. P., Casares, J., Martínez-Pais, I. G., & Charles, P. A. 2002, MNRAS, 334, 233 [Google Scholar]
- Torres, M. A. P., Jonker, P. G., Steeghs, D., & Seth, A. C. 2008, ATel, 1817, 1 [Google Scholar]
- van den Eijnden, J., Baglio, M. C., Homan, J., et al. 2021, ATel, 14317, 1 [Google Scholar]
- van Grunsven, T. F. J., Jonker, P. G., Verbunt, F. W. M., & Robinson, E. L. 2017, MNRAS, 472, 1907 [Google Scholar]
- Warner, B. 1995, Camb. Astrophys. Ser., 28 [Google Scholar]
- Welsh, W. F., Robinson, E. L., & Young, P. 2000, AJ, 120, 943 [Google Scholar]
- Whitehurst, R., & King, A. 1991, MNRAS, 249, 25 [NASA ADS] [CrossRef] [Google Scholar]
- Wilson, R. E. 1972, ApJ, 174, L27 [Google Scholar]
- Wolff, M. T., Becker, P. A., Ray, P. S., & Wood, K. S. 2005, ApJ, 632, 1099 [Google Scholar]
- Zhu, H., Tian, W., Li, A., & Zhang, M. 2017, MNRAS, 471, 3494 [NASA ADS] [CrossRef] [Google Scholar]
- Zurita, C., Casares, J., & Shahbaz, T. 2003, ApJ, 582, 369 [NASA ADS] [CrossRef] [Google Scholar]
Appendix A: Mr − Porb correlation
A relationship between the absolute r-band magnitude (Mr) for BH-XRTs in quiescence and their orbital period (Porb) was established by Casares (2018). To investigate whether NS-XRTs follow this relationship, we analysed four well-studied systems.
We calculated absolute r-band magnitudes (Mr) through the distance modulus, retrieving the necessary orbital periods and distances for each system. Following Cardelli et al. (1989), we applied a standard reddening law with RV = 3.1 and calculated the extinction in the r-band as Ar = 0.748 AV.
The systems studied were:
-
Cen X-4, with P = 15.0972 ± 0.0001 h (Torres et al. 2002) and a distance d = 1.9 ± 0.6 kpc obtained from the Gaia database (Gaia Collaboration 2020). For this system, we adopted E(B − V) = 0.1 (Blair et al. 1984; Shahbaz et al. 1993) and derived Mr from the observed magnitude r = 17.84 ± 0.04 (van den Eijnden et al. 2021).
-
Aql X-1, having P = 18.71 ± 0.06 h (Welsh et al. 2000) and d = 6 ± 2 kpc (Mata Sánchez et al. 2017). In this case, assuming E(B − V) = 0.5 and (V − R)0 = 0.8 (consistent with a K-type companion), we converted V- and I-band magnitudes from Chevalier et al. (1999) using SDSS transformation equations5 to obtain r = 20.65 ± 0.45.
-
XTE J2123-058, with P = 5.9562 ± 0.0001 h (Tomsick et al. 2002; Casares et al. 2002) and d = 8.5 ± 2.5 kpc (Tomsick et al. 2004). For this target, we used E(B − V) = 0.13 (Hynes et al. 2001) with the faintest magnitude found in Pan-STARRS DR2 photometry, giving r = 21.92 ± 0.15.
-
EXO 0748-676, possessing P = 3.8241 ± 0.0001 h (Hertz et al. 1997) and d = 7.7 ± 0.9 kpc (Wolff et al. 2005). Here, we used E(B − V) = 0.06 (Parikh et al. 2021) and r = 22.12 ± 0.04 (Torres et al. 2008).
Our results, presented in Fig. A.1, show that the behaviour of these NS-XRTs is consistent with the Mr − Porb correlation established by Casares (2018) for BH-XRTs. Therefore, NS-XRTs likely follow a similar trend, at least within the 3 to 16 hour orbital period range tested here.
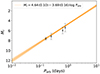 |
Fig. A.1. Mr − Porb correlation obtained by Casares (2018) for BH-XRTs (in orange). The black dots correspond to NS-XRTs, showing that they also satisfy the Mr − Porb correlation. |
All Tables
All Figures
|
Fig. 1. 600 s R-band image of J1807 in quiescence, obtained with the WFC on the night of 24 June 2022. The target (J1807), the reference star (R), and comparison stars are marked with circles. North is at the top, and east is to the left. |
| In the text | |
|
Fig. 2. Light curves obtained on 23−24 June 2022 and 27 July 2022. The time is in units of days since HJD 2459754.5. Upper panel: Seeing conditions for each observation. Middle panel: Light curve of J1807. Lower panel: Light curve of the comparison stars marked in Fig. 1, demonstrating photometric stability. |
| In the text | |
|
Fig. 3. Lomb-Scargle periodogram of the J1807 light curve for the nights of 24−25 June. The Lomb-Scargle power of the signal is in black, and the window function in orange. The red vertical line marks the main peak at 2.129 hours; dotted grey ticks at the top indicate the daily aliases (±1, ±2 d−1). The period has a significance greater than 4σ. |
| In the text | |
|
Fig. 4. Phase-folded light curves on the 4.258 h of J1807. The reference epoch used was T0.5(HJD) = 2459755.572. The observation dates are given in the upper right of each panel. |
| In the text | |
|
Fig. 5. Light curve modelling. Upper panel: J1807 data (black dots) and the synthetic light curves based on the 68% confidence intervals from the MCMC analysis (red lines). The teal line indicates the best-fit model. Lower panel: Residuals from the best-fit model (black dots) and for each individual synthetic light curve (red lines). |
| In the text | |
|
Fig. 6. Correlation diagrams showing the probability distributions of the best-fit parameters from the MCMC modelling of the ellipsoidal light curve. The 2D plots display contours corresponding to the 68%, 95%, and 99.7% confidence regions. Rightmost panels: Projected 1D distributions of the parameters, with the median indicated by a solid line and the 68% confidence intervals marked by dashed lines. The value of K2 is inferred from q, MNS, P, and i, whereas the value of M2 is inferred from q and MNS. |
| In the text | |
|
Fig. A.1. Mr − Porb correlation obtained by Casares (2018) for BH-XRTs (in orange). The black dots correspond to NS-XRTs, showing that they also satisfy the Mr − Porb correlation. |
| In the text | |
Current usage metrics show cumulative count of Article Views (full-text article views including HTML views, PDF and ePub downloads, according to the available data) and Abstracts Views on Vision4Press platform.
Data correspond to usage on the plateform after 2015. The current usage metrics is available 48-96 hours after online publication and is updated daily on week days.
Initial download of the metrics may take a while.