Open Access
Fig. 10
Download original image
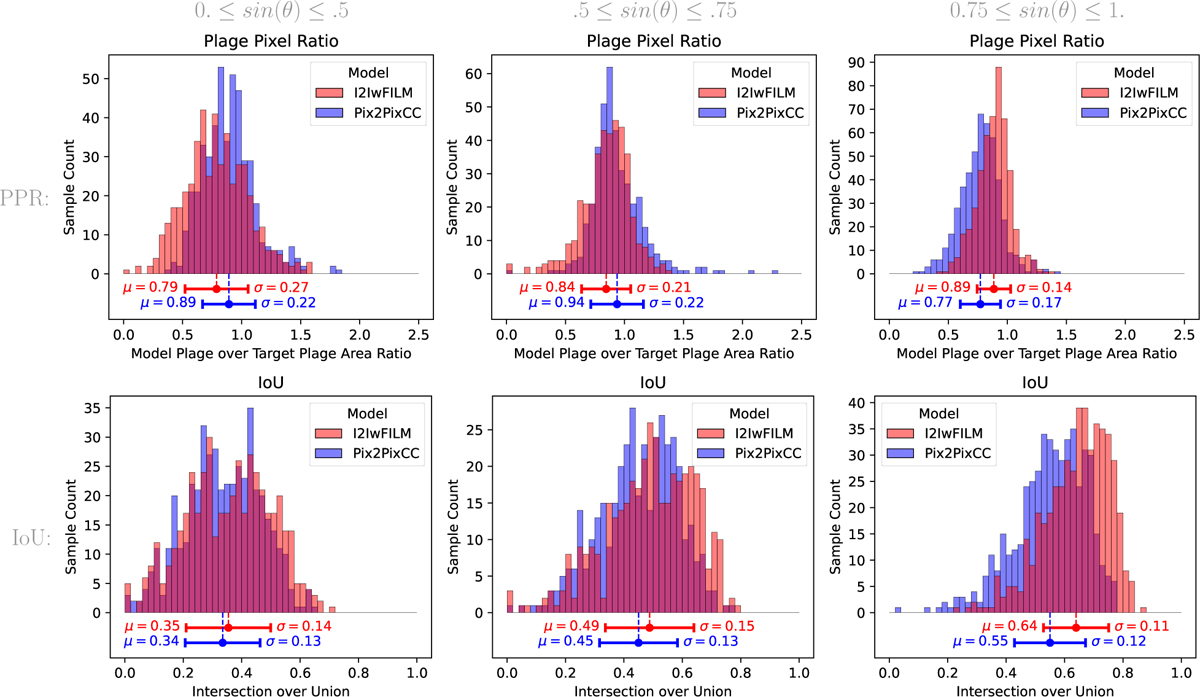
Plage reconstruction performance of Pix2PixCC and I2IwFiLM models for active regions located near the center of the sun (left column), at intermediate distance to the center (middle column), and near the limb (right column). Top row shows PPR metric histograms. Bottom row shows intersection over union (IoU) histograms.
Current usage metrics show cumulative count of Article Views (full-text article views including HTML views, PDF and ePub downloads, according to the available data) and Abstracts Views on Vision4Press platform.
Data correspond to usage on the plateform after 2015. The current usage metrics is available 48-96 hours after online publication and is updated daily on week days.
Initial download of the metrics may take a while.