Fig. 8
Download original image
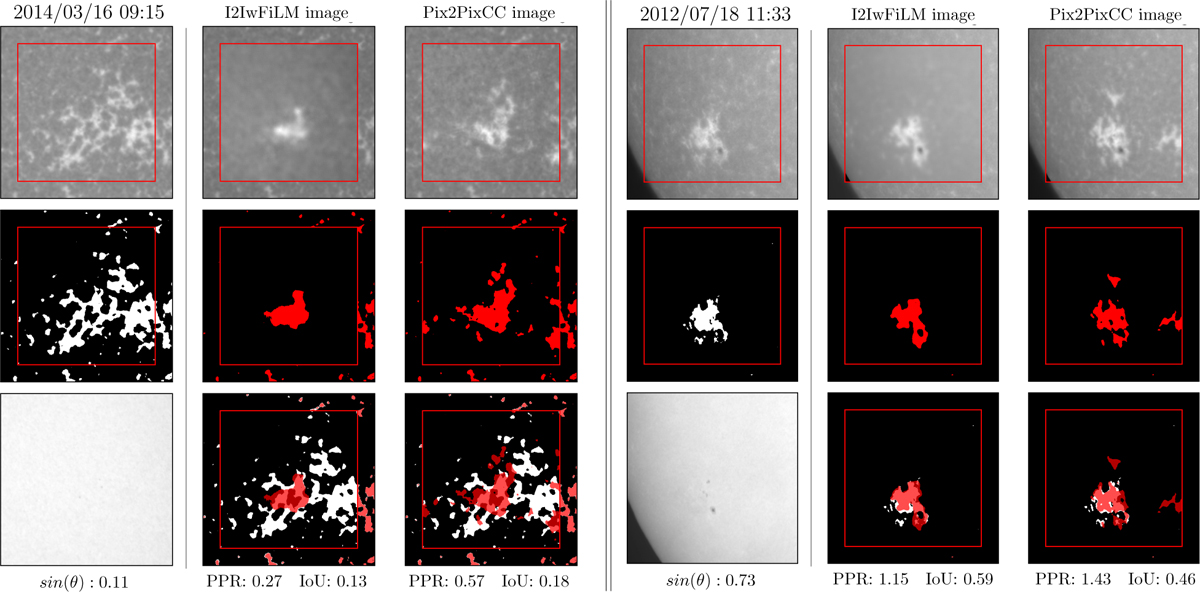
Subpar CaIIK reconstructions of ARs near the center of the solar disk (left grid) and near the limb (right grid). In each 3 × 3 grid: the top row shows the original CaIIK image (left) and its reconstructions by I2IwFiLM (middle) and Pix2PixCC (right). The middle row shows segmentation masks of plages visible in the original CaIIK image (left) and the corresponding reconstructions by I2IwFiLM (middle) and Pix2PixCC (right). Bottom row shows input white light (WL) image (left) and overlays of the target plage mask with the model-generated plage masks from I2IwFiLM (middle) and Pix2PixCC (right), facilitating a direct comparison.
Current usage metrics show cumulative count of Article Views (full-text article views including HTML views, PDF and ePub downloads, according to the available data) and Abstracts Views on Vision4Press platform.
Data correspond to usage on the plateform after 2015. The current usage metrics is available 48-96 hours after online publication and is updated daily on week days.
Initial download of the metrics may take a while.