Open Access
Fig. 3.
Download original image
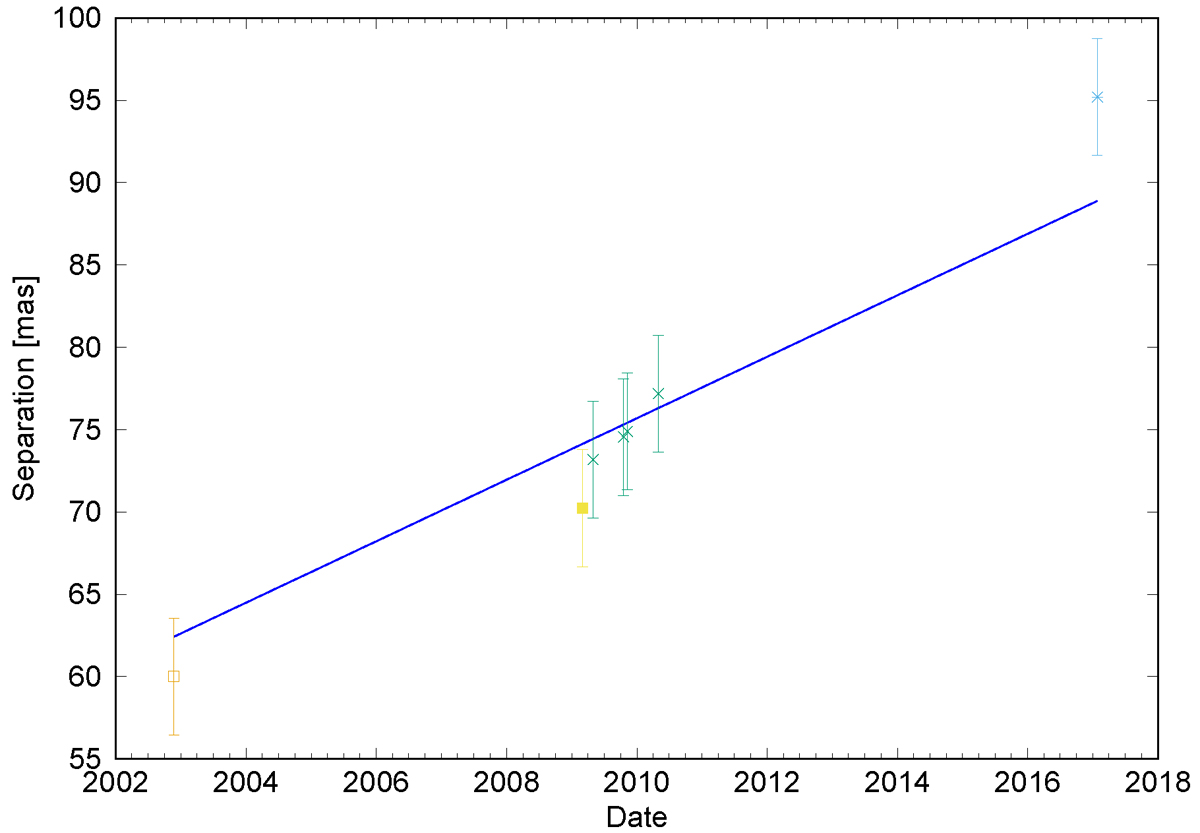
Median separation between the northern and southern water maser cluster in the observations from Desmurs et al. (2007) shown as an open square, Leal-Ferreira et al. (2012) as a filled square, Dodson et al. (2018) as a blue x, and our own data as a green x. The blue line is a linear fit to all data.
Current usage metrics show cumulative count of Article Views (full-text article views including HTML views, PDF and ePub downloads, according to the available data) and Abstracts Views on Vision4Press platform.
Data correspond to usage on the plateform after 2015. The current usage metrics is available 48-96 hours after online publication and is updated daily on week days.
Initial download of the metrics may take a while.