| Issue |
A&A
Volume 702, October 2025
|
|
|---|---|---|
| Article Number | A141 | |
| Number of page(s) | 8 | |
| Section | Stellar structure and evolution | |
| DOI | https://doi.org/10.1051/0004-6361/202555348 | |
| Published online | 16 October 2025 | |
Investigating the nature of the protoplanetary nebula OH 231.8+4.2
1
Max-Planck-Institut für Radioastronomie, Auf dem Hügel 69, 53121 Bonn, Germany
2
Center for Astrophysics | Harvard & Smithsonian, 60 Garden Street, Cambridge MA 02138, USA
⋆ Corresponding authors: This email address is being protected from spambots. You need JavaScript enabled to view it.
, This email address is being protected from spambots. You need JavaScript enabled to view it.
, This email address is being protected from spambots. You need JavaScript enabled to view it.
Received:
30
April
2025
Accepted:
13
August
2025
Abstract
Aims. The protoplanetary nebula OH 231.8+4.2, also known as the Rotten Egg or Calabash nebula, is seen in the direction of the open cluster M 46. While an association between the nebula and the cluster has been suggested in the past, it was never confirmed. Here, we present accurate trigonometric parallax and proper motion measurements using very-long-baseline interferometry (VLBI) observations of masers in the nebula and Gaia DR3 data for the cluster.
Methods. We observed 22 GHz H2O and 43 GHz SiO masers around OH 231.8+4.2, with the Very Long Baseline Array (VLBA) in four epochs over the course of one year. We also calculated the parallax and proper motion of the open star cluster M 46 using Gaia DR3 data.
Results. Based on astrometric monitoring for one year, we measured an annual parallax for OH 231.8+4.2 of 0.65 ± 0.01 mas (stat.) ± 0.02 mas (syst.), corresponding to a distance of 1.54 ± 0.05 kpc. This agrees well with the parallax for M 46 drawn from Gaia DR3 data, which is 0.639 ± 0.001 mas (stat.) ±0.010 mas (syst.). We re-estimated the luminosity of OH 231.8+4.2 to be 1.4 × 10⁴ L⊙. However, there is a 15km s−1 velocity difference between OH 231.8+4.2 and M 46, which could potentially have been caused by a past merger event.
Key words: masers / astrometry / stars: distances / stars: late-type / stars: individual: OH 231.8+4.2
In memory of Karl Menten, who suddenly passed away before completing this work. His invaluable advice and contributions will be deeply missed.
© The Authors 2025
 Open Access article, published by EDP Sciences, under the terms of the Creative Commons Attribution License (https://creativecommons.org/licenses/by/4.0), which permits unrestricted use, distribution, and reproduction in any medium, provided the original work is properly cited.
This article is published in open access under the Subscribe to Open model.
Open access funding provided by Max Planck Society.
1. Introduction
A protoplanetary nebula (PPN) denotes the transition phase from an asymptotic giant branch (AGB) star to a planetary nebula (PN). The transition lasts a short time (thousands of years) in the evolutionary scope of low-mass stars. While most AGB stars have approximately spherically symmetric circumstellar envelopes, PPNe and PNe show strong asymmetries, along with frequently collimated bipolar winds. In addition, H2O and SiO maser emission may arise in regions very close to the photosphere of the central object of a PPN, which still retains its AGB stellar characteristics, where hydrogen shell burning has not yet raised the central star’s effective temperature to prohibitively high levels. Since these masers form in the inner circumstellar envelope (see, e.g., Reid & Menten 1990; Vlemmings et al. 2006; Reid & Menten 2007; Imai et al. 2007), they are good probes of the formation processes of bipolarity.
OH 231.8+4.2 (or OH 0739−14) has been classified as a PPN, revealing OH, H2O, and SiO maser emission. It was first discovered by its peculiar 18 cm OH maser emission, which covered an uncommonly wide velocity range in (only) the 1667 MHz hyperfine structure line (Turner 1971). OH 231.8+4.2 has also been named the Calabash nebula, given its morphology displays a shocked bipolar outflow (see, e.g., Reipurth 1987). It is also referred to as the Rotten Egg Nebula because of the prevalence of sulfur-bearing molecules, such as SO, SO2, and H2S, which highlight its rich and (for an evolved star) peculiar chemical composition (Morris et al. 1987).
According to Sánchez Contreras et al. (2004), the central source of OH 238.8+4.2 is a binary system, composed of an M9-10 III Mira variable (an AGB star) and an A0 main sequence companion. It shows a highly collimated bipolar outflow in CO emission (J = 1 − 0 and 2 − 1 lines) (Alcolea et al. 2001), with an dynamic age of about 800 years (Bujarrabal et al. 2002). It has been suggested that gas accreting from the Mira star to a companion in a close interaction formed an accretion disk powering the outflows (Soker & Kashi 2012). Based on this scenario, Staff et al. (2016) performed hydrodynamical simulations that showed that this interaction would have led to a merger of the two stars, indicating that the system had initially been a triple system. The central Mira star in OH 231.8+4.2, also known as QX Pup, is variable with estimated periods of 648 (Feast et al. 1983) and 708 days (Kastner et al. 1992). It exhibits a luminosity between 104 to 2 × 10⁴ L⊙ (Kastner et al. 1998).
Previous VLBI observations (Desmurs et al. 2007) determined the positions of the H2O (61, 6 − 52, 3) and SiO (v = 2, J = 1 – 0) masers. The H2O maser clumps were detected in two regions separated by 60 mas in the north-south direction, roughly along the axis of the much larger scale bipolar outflow; in addition, the blue- and red-shifted masers are distributed in the same sense as they are on larger scales. Furthrermore, SiO masers are generally located within ≈5 stellar radii of Mira stars. Therefore they indicate the position of the Mira component of the binary system. In OH 231.8+4.2, the SiO maser emission is found between the two H2O maser regions and has a distribution that is elongated perpendicular to the nebular axis, suggesting the presence of an equatorial torus or disk around the central star.
An plausible association of OH 231.8+4.2 with the open star cluster M 46 was suggested by Jura & Morris (1985), with a distance estimated at 1.3 ± 0.4 kpc (Kastner et al. 1992). More recently, estimates for the distance to M 46 using Gaia DR2 data range from 1.64 kpc (Cantat-Gaudin et al. 2018) to 1.67 kpc (Gaia Collaboration 2018). The age of the cluster is about 320 Myr (Tarricq et al. 2021). We note that the PN NGC 2438 is also seen in the direction of M 46; however, it has been shown that this PN is a foreground object (Kiss et al. 2008).
While OH 231.8+4.2 is also listed in the first VERA catalog (VERA Collaboration 2020) with a distance of 1.64 ± 0.08 kpc, the cited work reporting this value has not yet been published. Since the central star is heavily obscured at optical wavelength, a direct parallax measurement of OH 231.8+4.2 with Gaia is not possible. However, a reliable distance is crucial to study the properties of the nebula. Trigonometric parallaxes of circumstellar maser sources (H2O and/or SiO) in late-type stars have been measured with VLBI phase-referencing with accuracies of ±40 to 80 μas (Choi et al. 2008; Tafoya et al. 2011; Zhang et al. 2012a,b; Nakagawa et al. 2016).
In this paper, we present an accurate trigonometric parallax measurement of OH 231.8+4.2. In Section 2, we describe the observations and data reduction. In Section 3, we present our results. In Section 4, we give an update on the distance to the open cluster M 46 Gaia DR3. Finally, we summarize the most important results in Section 5.
2. VLBA observations and data reduction
Our observations were carried out using the NRAO1 Very Long Baseline Array (VLBA) under program BC188. Since astrometric accuracy is improved by using background sources near in angle to the target, we conducted a brief survey on 2009 February 1 (BC188A) to find suitable phase-reference sources before starting parallax measurements. We observed six candidate background sources from the VLBA Calibrator Survey (VCS) with angular separations < 3.5 degrees for OH 231.8+4.2 at 22 and 43 GHz. The absolute position of the observed sources from the ICRF2 catalog and our measured brightness values are listed in Table 1.
Source information.
Our VLBA observations of H2O and v = 2, J = 1 – 0 SiO masers were performed over 8 hour tracks on 2009 May 01, Oct 19, Nov 09 and 2010 May 01. Observational parameters are listed in Table 2. The rest frequencies of the observed H2O and SiO lines are 22235.08 and 42820.586 MHz, respectively. The dates were designed to optimize the parallax measurement by sampling near the maximum and minimum of the parallax signatures in right ascension (RA). We did not optimize for the declination (Dec), since its parallax signature is smaller than that of the RA, while Dec position measurements generally have larger uncertainties for low-declination sources, such as our target.
Observation information
To measure a trigonometric parallax, we used phase-referencing observations, switching quickly between the maser target and an extragalactic continuum source. We used one background source (J0746–1555) for the H2O maser and two background sources (J0746–1555 and J0748–1639) for the SiO maser observations. J0746-1555 is located 1.55° from OH 231.8+4.2. The second calibrator at 43 GHz was added as a back up calibrator in the case that the primary calibrator was not bright enough at the higher frequency. While J0748-1639 was brighter, it was located 2.4° from OH 231.8+4.2, making it less suitable for astrometry. We alternated between one block at 22 GHz and two blocks at 43 GHz. We switched sources every 40 seconds at 22 GHz and every 25 to 30 seconds at 43 GHz. A strong source, J0530+1331, was observed approximately hourly to monitor delay and electronic phase differences among the IF bands. To calibrate the atmospheric delays for each antenna, we placed geodetic blocks (Brunthaler et al. 2005; Reid et al. 2009a) before the start, in the middle, and after the end of phase-referencing observations.
The data were correlated in two passes with the VLBA DiFX software correlator2 (Deller et al. 2007) in Socorro, NM. The four dual-polarized frequency bands of 8 MHz bandwidth were first processed with 16 spectral channels for each frequency band. Next, the frequency band containing maser emission was re-correlated with 1024 channels, giving channel spacings of 0.10 km s−1 at 22 GHz and 0.05 km s−1 at 43 GHz. The data reduction was performed with the NRAO’s Astronomical Image Processing System (AIPS) package, using ParselTongue (Kettenis et al. 2006) scripts developed for the Bar and Spiral Structure Legacy (BeSSeL) survey3 (Brunthaler et al. 2011) following the procedures described in Reid et al. (2009a).
3. Results
3.1. Spectrum and spatial distribution of water masers
Figure 1 shows the H2O maser spectra toward OH 231.8+4.2 at all four epochs, produced by scalar averaging the data over all observing time spans and baselines. The H2O masers span LSR velocities from 24 to 43 km s−1, covering the systemic velocity of the nebula of 34 km s−1 (Alcolea et al. 2001). The maser features divide into two groups: blue-shifted features at VLSR between 24 and 30 km s−1 and red-shifted features between 37 and 43 km s−1. Although the masers vary in flux density, the overall spectral appearance is qualitatively similar at all epochs, suggesting that many maser spots survive over the observing period of one year. We selected the strong maser spot at VLSR of 25.52 km s−1 as a reference spot.
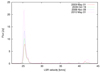 |
Fig. 1. Spectra of the H2O masers toward OH 231.8+4.2 produced by scalar averaging the data over all time and baseline. Four different lines represent different epochs. |
We defined a maser feature, when maser spots are detected stronger than 7σ in three consecutive channels. The positions and intensities of the maser features are obtained from the peak emission from the epoch at which it was first detected during our observations. These are listed in Table 3. The spatial distributions of the H2O masers in OH 231.8+4.2 relative to the reference maser spot at all epochs are shown in Figure 2. The H2O masers are located within 40 mas in the east-west and 100 mas in the north-south directions. The blue-shifted components are located in the north, while the red-shifted components are in the south. The northern components are stronger than the southern components. The overall appearance is very similar between the epochs, with two and four maser spots newly appearing at the second and fourth epoch, respectively.
H2O maser features toward OH 231.8+4.2.
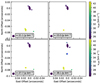 |
Fig. 2. Spatial distribution of the H2O masers in OH 231.8+4.2 at all epochs (top left: 1; top right: 2; bottom left: 3; bottom right: 4). The LSR velocities of the maser spots are indicated by the color bar to the right. The reference spot at VLSR = 25.52 km s−1 is located at (0,0). The blue and green stars in the bottom right map show the location of the SiO maser spots at 27.26 and 32.23 km s−1, respectively. |
We detected 20 H2O maser features in at least one epoch; this compares to 16 features detected by Desmurs et al. (2007), 30 features by Leal-Ferreira et al. (2012), and 20 features detected by Dodson et al. (2018). Compared with these other VLBI observations of the H2O masers, the overall structure of the features’ distribution is similar, with blue-shifted features in the north and red-shifted features in the south. However, the details of the spatial distribution were found to have changed over time. For example, we could not detect some northeast maser features at VLSR ∼ 29 km s−1 in Desmurs et al. (2007) and Leal-Ferreira et al. (2012), but new maser features in the southern complex appeared at VLSR between 38 and 41 km s−1 in our observations. The masers in the north have been consistently brighter by a factor of 3−4 in our observation, as well as the previous observations from Desmurs et al. (2007) and Leal-Ferreira et al. (2012). However, this has changed in the later observation by Dodson et al. (2018) where the southern masers are slightly brighter than the northern masers.
Dodson et al. (2018) combined a new observation in 2017 with the previously published observations to measure the median distance between the northern and southern clusters. We repeated this analysis by adding the data from our four epochs and the results are shown in Fig. 3. A linear fit to all data, shows that the separation between the two clusters grows with 2.5 ± 0.2 mas yr−1, corresponding to 17.3 ± 1.5 km s−1 for our measured distance (see next section), consistent with the estimate of 19 km s−1 in Dodson et al. (2018). The uncertainty is estimated from the scatter in the individual measurements. The median velocity of the features in the northern and southern clusters are 26.3 and 40.8 km s−1, respectively. Comparing the velocity difference in the plane of the sky (17.3 km s−1) with the velocity difference in radial velocities (14.5 km s−1), yields an inclination angle of ∼40°, which is comparable to previous estimates of 36° (Kastner et al. 1992). This expansion is much slower than the velocities seen on larger scales from the CO emission, which reach de-projected velocities of –210 km s−1 and 376 km s−1 for the northern and southern lobes, respectively (Alcolea et al. 2001). This striking difference in expansion velocities between the water maser emission and the large-scale CO outflow could be explained by a fast moving jet or outflow where the maser emission is exited by a fast outflow which interacts with the denser circumstellar environment, as proposed by Tarter & Welch (1986).
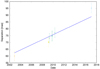 |
Fig. 3. Median separation between the northern and southern water maser cluster in the observations from Desmurs et al. (2007) shown as an open square, Leal-Ferreira et al. (2012) as a filled square, Dodson et al. (2018) as a blue x, and our own data as a green x. The blue line is a linear fit to all data. |
3.2. Parallax and proper motion of the water masers
Figure 4 shows position measurements of the H2O maser spot at a LSR velocity of 25.52 km s−1 (the reference spot) relative to the background continuum source J0746–1555 over a time span of one year. The position offsets relate to α(J2000) = 07h42m16s.9175 and δ(J2000) =  .
.
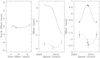 |
Fig. 4. Parallax and proper motion fit for OH 231.8+4.2. For each plot, points with error bars are position measurements of the H2O maser spot at VLSR of 25.52 km s−1 relative to the background quasar J0746–1555. Left panel: Motion of the maser on the sky. Middle panel: Change of position eastward (solid line) and northward (dashed line) as a function of time. The northward data have been shifted downward for clarity. Right panel: Same as the middle panel after removing the best-fitting linear proper motion. |
We obtained an annual parallax and proper motion by variance-weighted least-squares fitting the position versus time data for the H2O maser spots in OH 231.8+4.2 detected at all four epochs. While the parallaxes should be identical within measurement uncertainties for all spots, the proper motions could reflect differing internal motions of the spots. Our results are listed in Table 4. The measured parallaxes are in good agreement, suggesting any unresolved structural changes in the maser spots are minimal. The estimated parallax is 0.65 ± 0.01 mas (statistical uncertainty).
Parallax and proper motions fits of the H2O masers.
Our observations employed a single background quasar and had only four epochs. Since the east-west data dominate the parallax solution, there are only four data points to solve for three parameters (parallax, position offsets, and motion). This leaves only one degree of freedom to estimate the full uncertainty, including systematic effects for the parallax. While this does not bias the parallax estimate itself, the uncertainty can be over- or underestimated by ∼44% as shown in Reid et al. (2017). Therefore, we conservatively estimate a systematic uncertainty, predominantly owing to uncompensated tropospheric delays, of ±0.02 mas. Thus, our final result is 0.65 ± 0.01 (statistical) ±0.02 (systematic) mas. This corresponds to a distance of 1.54 ± 0.05 kpc. To get an estimate of the absolute motion of the AGB star, we averaged the two red-shifted features and then split the difference between the red and blue values. This results in μx = –4.45 ± 0.45 mas yr−1 eastward and μy = –0.50 ± 1.2 mas yr−1 northward.
3.3. SiO maser emission
Unlike the H2O maser emission, the SiO maser emission was very weak during our observations. We were able to detect only two maser features at LSR velocities of 27.26 and 32.23 km s−1 phase-referenced to the quasar J0746–1555 at the fourth epoch (BC188E). These two SiO maser spots are separated by 1.3 mas and lie between the two clusters of H2O masers, as shown in the last panel of Fig. 2. This presumably indicates the location of the central AGB star. Dodson et al. (2018) used the Korean VLBI Network and its unique capability to observe the water and SiO masers simultaneously to do an accurate astrometric alignment between the two maser species. They also found that the SiO maser emission is located between the two clusters of water maser emission. We note that both observations locate the SiO masers slightly closer to the northern cluster than to the southern cluster, with a distance ratio approximately at 40/60.
The absolute position of the spots at 27.26 km s−1 in the fourth epoch is α(J2000.0) = 07h42m16s.91726 and δ(J2000.0) =  . The uncertainty in the absolute position is dominated by the uncertainty in the position of the calibrator, which is ±0.72 mas in RA and ±1.32 mas in Dec (Fomalont et al. 2003). Desmurs et al. (2007) observed the SiO masers with the VLBA in phase reference mode in 2003. They also identified two maser spots at 27 and 32 km s−1 and obtained an absolute position for the maser spot at 27 km s−1, which differs by 38.9 mas in RA and 3.3 mas in Dec from our positions. Since the 2003 observation was in early July, while our 2010 epoch was conducted in early May, the contribution of the parallax effect is insignificant, and the difference in position can be attributed to the proper motion of the central Mira star QX Pup. This gives a proper motion of –5.7 ± 0.2 mas yr−1 in RA and –0.48 ± 0.2 mas yr−1 in Dec.
This proper motion is similar to the proper motion estimated from the water maser emission. While the motion in the declination is in perfect agreement, there is a 2.5 sigma difference in the proper motion in RA. Since the SiO maser emission originates much closer to the star itself, than the water masers, the SiO maser proper motion is a much better representation of the motion of the star; thus, this is the value we have adopted in this work.
4. Gaia EDR3 data
OH 231.8+4.2 is located only ∼11′toward the north-east of the center of the open cluster M 46 (NGC 2437). The cluster has an r50 radius (i.e. the radius contains 50% of the stars) of 10.5′ (Hunt & Reffert 2023). Therefore, OH 231.8+4.2 is believed to be associated with M 46. The distance of M 46 can be also estimated with Gaia EDR3 data. To select members of the cluster, we first selected all stars with a distance of less than 0.8 degrees from the cluster center. We used only sources where the ratio of the parallax and the formal parallax uncertainty was larger than 10. To reduce the contamination of possible binary systems we follow the recommended cuts from Fabricius et al. (2021):
-
ruwe < 1.4;
-
ipd_frac_multi_peak ≤ 2;
-
ipd_gof_harmonic_amplitude < 0.1.
Next, we used only stars that had proper motions within ±1 mas yr−1 of the cluster proper motion as given in Gaia Collaboration (2018). We then reduced the allowed proper motion range, by calculating the standard deviation of the proper motions and allowing only the stars that have proper motions within 3σ of the cluster mean proper motion. We repeated this process until the standard deviation of the proper motions did not change anymore. This resulted in the final cuts of |pmra + 3.86|< 0.4 mas yr−1 and |pmdec − 0.4|< 0.4 mas yr−1. These cuts gave us a list of 1316 possible cluster members.
We then applied the parallax zero-point correction from (Lindegren et al. 2021b). While the validity of this zero-point correction has been confirmed by a number of studies, Huang et al. (2021) showed that there is a small over-correction in the magnitude range from 13 < G < 16. Hence, we applied a additional correction of 5(G − 13) μas for this magnitude range as described in Leung et al. (2023) and removed any stars which are fainter than G > 16 mag. There are several stars, which are clearly fore- or background objects, so we also remove stars with parallaxes which differ from the mean parallax by more than five times the parallax uncertainty of the star. These additional cuts leave 1036 stars. To check the consistency of the parallax measurements, we plot the parallax value versus the apparent G magnitude of the stars in Fig. 5 (upper panel). Here, we can clearly see, that many stars within the G magnitude range from about 11.5 < G < 12.5 have on average larger parallaxes. It is not clear what causes this apparent bias. One possibility is that the zero-point correction is not adequate for these stars. However, all of these sources have a non-zero astrometric_excess_noise. We therefore added one additional cut and removed all stars with astrometric_excess_noise_sig > 2 (see section 5.1.2 of Lindegren et al. 2012). This results in our final list of 747 stars, which for a much cleaner sample as shown in the lower panel of Fig. 5.
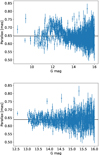 |
Fig. 5. Upper panel: Parallaxes of individual stars in M 46 plotted against the apparent G magnitude of the star. The horizontal line marks the average parallax. Lower panel: Same as the upper panel, but removing stars with astrometric_excess_noise_sig > 2. The average parallax changed by 8 μas. |
Using this clean sample of member stars, the average parallax of all stars is 0.639 mas (and a median of 0.638 mas) with an formal error of only 1.2 μas. This formal error underestimates the true uncertainty, since the measurements for the 747 stars are not truly independent. For example, the over-correction seen by Huang et al. (2021) has not been independently confirmed and there are spatial correlations on small scales (Lindegren et al. 2021a), which introduce an additional bias (noting that about 50% of all stars are within 0.2° of the cluster center). Using Equation (24) from Lindegren et al. (2021a), we assigned a systematic uncertainty of 10 μas to the result, which gives us a final parallax of 0.639 ± 0.001 ± 0.010 mas.
The average proper motion of the final 747 stars is –3.861 mas yr−1 in RA and 0.399 mas yr−1 in Dec. The formal uncertainties are 0.005 mas yr−1 in both directions. The velocity dispersion is 0.13 mas yr−1 in both directions, which corresponds to 0.9 km s−1. While there is also a bias in the proper motions, for which Cantat-Gaudin & Brandt (2021) provided a recipe correction, these corrections are only defined for stars with a G magnitude brighter than 13. However, these stars were all (except one) removed by our cut on the astrometric excess noise. However, if we were to apply the corrections to the 289 stars brighter than G < 13 from our sample before this cut, the bias corrections would range from –0.013 to +0.017 mas yr−1 with a median of 0.012 mas yr−1 in RA and from 0.025 to 0.061 mas yr−1 with a median of 0.051 mas yr−1 in Dec. Since it is not clear how this bias affects the weaker stars in our final sample, we therefore assumed additional systematic uncertainties of 0.012 mas yr−1 in RA and 0.051 mas yr−1 in Dec. This leads us to the final proper motions of –3.861 ± 0.005 ± 0.012 mas yr−1 and 0.399 ± 0.005 ± 0.051 mas yr−1 in RA and Dec, respectively.
5. Discussion
The agreement between our VLBI maser parallax for OH 231.8+4.2 of 0.65 ± 0.01 (statistical) ± 0.02 (systematic) mas and the Gaia EDR3 parallax for M 46 of 0.639 ± 0.001 (statistical) ± 0.01 (systematic) mas, within the uncertainties, clearly shows that the nebula is part of the open cluster.
Previously, the distance to OH 231.8+4.2 was estimated to be 1.3 ± 0.4 kpc (Kastner et al. 1992), assuming that OH 231.8+4.2 is a member of the cluster (Jura & Morris 1985). On the other hand, the kinematic distance using the systemic LSR velocity of 34 km s−1 is ≈3.7 kpc (more than twice our measured distance). Our parallax distance of OH 231.8+4.2 is 1.54 kpc (with a 5% error), which suggests that the kinematic distance is anomalous.
In previous studies, the luminosity was estimated using the distance of 1.3 ± 0.4 kpc. While this distance is consistent with our result within their quoted uncertainty, it is 16% smaller than our result. Since the luminosity depends on a square of distance, luminosity estimates quoted by simply assuming a distance often without uncertainty were underestimated by 34%. With the parallax distance, the luminosity of OH 231.8+4.2 is 1.4 × 10⁴ L⊙, with about a 10% uncertainty from the distance.
While the parallax between our VLBI measurements and the estimate from Gaia is in excellent agreement, we find a significant difference in the measured proper motions of the nebula and the stars in the cluster (Table 5). Figure 6 shows a 2MASS color composite image of the open cluster M 46 and the location of OH 231.8+4.2. Also shown are the proper motions relative to the cluster as determined from the water and SiO masers, and the direction of the large scale CO outflow. If we assume that the motions of the SiO masers represent the motion of the AGB star, it with moves –1.84 mas yr−1 in RA and –0.88 mas yr−1 in Dec relative to the cluster of stars. This would correspond to tangential motions of 12.8 km s−1 and 6.1 km s−1 at our measured distance and is significantly larger than the velocity dispersion of the cluster itself. This apparent motion is directed at a position angle of 245° east of north. From the water masers, we would obtain tangential motions of 4.0 km s−1 in RA and 6.1 km s−1 in Dec and a position angle of 213° east of north. In any case, the motion is directed roughly toward the center of the cluster.
 |
Fig. 6. 2MASS color composite of M 46. The center of the open cluster is marked with an red X. OH 231.8+4.2 is also seen and its tangential motions derived from the water masers (cyan) and SiO masers (red) relative to M 46 are also shown. The yellow line marks the orientation of the large scale CO outflow. The white arrow in the bottom right corner corresponds to a tangential motion of 10 km s−1. |
Proper motions measurements of OH 231.8+4.2 and M 46.
The heliocentric radial velocity of the cluster is 46.9 ± 1 km s−1 (Frinchaboy & Majewski 2008; Kiss et al. 2008), corresponding to an LSR velocity of 28.9 km s−1, while the systemic LSR velocity of the nebula is 34 km s−1 (Alcolea et al. 2001). Here, we also find a difference of approximately 5 km s−1.
As discussed above, the proper motion of OH 231.8+4.2 does not agree with that of the cluster M 46. Ejected stars from open clusters are known for decades as runaway stars (Blaauw 1961) with velocities higher than 30 km s−1 or walkaway stars with velocities of a few to tens of km s−1 (de Mink et al. 2014). Two mechanisms have been proposed to explain the large velocities of the stars: dynamical ejection caused by few-body interactions (Poveda et al. 1967; Lennon et al. 2018; Kalari et al. 2019) and supernova explosions in a binary system (Blaauw 1961; Renzo et al. 2019; Chrimes et al. 2023).
OH 231.8+4.2 is located just outside the r50 radius of the cluster, and it is moving currently toward the center of M 46. Therefore, the system formed even further outside, where the stellar density is much lower than in the dense core of the cluster. Furthermore, the fraction of ejected stars drops with decreasing mass of the stars (e.g., Oh & Kroupa 2016). Hence, it seems unlikely that the discrepant velocity is caused by a dynamical interaction with other stars.
In the binary supernova scenario, the system formed as a triple system, where the most massive star exploded in a supernova. Renzo et al. (2019) showed that the large majority of stars ejected by supernova explosions in binary systems have velocities smaller than 30 km s−1, consistent with the motion of OH 231.8+4.2. However, it is not clear whether the remaining two stars would have remained bound after such a disruptive event. While neither explanation can be ruled out and further investigations with detailed simulations would be required to confirm them, they still cannot explain the origin of the bipolar outflow seen in the source.
Another possible origin for the velocity discrepancy and the bipolar outflow could be that the phenomena observed in OH 231.8+4.2 are the result of a stellar merger, as suggested by Staff et al. (2016). A merger can be the result of orbital decay in a multiple stellar system. Since the velocities of the remnant objects are determined by the dynamics of the merger process, they are decoupled from original space velocity of the system. This is well illustrated by the example of source I and other sources in the Orion Kleinmann Low nebula within the core of Orion Molecular Cloud 1, whose proper motions have been measured with the Very Large Array (Gómez et al. 2008). These authors show that the three sources move away from each other with on-the-sky velocities of 15 to 26 km s−1 and shared a common origin 500 y ago. The aftermath of the explosion accompanying the merger is observed in vibrationally excited H2 emission and CO emission which shows a spherically symmetric distribution. The fact that Orion I is indeed the result of a merger had been proposed by (Bally & Zinnecker 2005). At radio and mm wavelengths, source I has the morphology of an edge-on disk. The disk is associated with strong SiO maser emission, which expands away from it that is at the base of large scale bipolar outflow traced by thermal SiO emission.
Recently, a small sample of sources have been closely studied that, such as Orion I, share characteristics with OH 231.8+4.2; in particular, are they characterized by high velocity and chemically peculiar molecular material. These are so-called “red novae,” due to their sudden appearance in the sky, which is accompanied by copious production of dust (and molecules). In their discussion of the prominent case of the red nova (RN) V838 Mon, which experienced a major outburst in early 2002, Soker & Tylenda (2003) proposed the merger of two main sequence stars as the energy source. The main compact remnant of the merger is an M-type stellar object with red supergiant characteristics, associated with SiO maser emission (Deguchi et al. 2005; Ortiz-León et al. 2020). We note that SiO maser emission also is an outstanding characteristic of Orion I (see Menten & Reid 1995, and references therein).
Kamiński et al. (2018) present millimeter/submillimeter-wavelength observations with the Atacama Large Millimeter Array (ALMA) and the Submillimeter Array (SMA) of three well-studied Galactic red novae, V4332 Sgr, V1309 Sco, and V838 Mon. Although they only covered a limited frequency range, they detected emission from CO, SiO, SO, and SO2 in all three sources. Additionally, a line from H2S was covered and detected toward V 838 Mon. In fact, these sulfur-bearing species have motivated the Rotten Egg Nebula’s name. Kamiński et al. (2015, 2017) presented a much larger amount of molecular line data for the archetypal red nova CK Vul, which was discovered as Nova Vul 1670 more than 350 y ago.
While the molecular line emission of all of the mentioned RNe is characterized by wide line widths of up to 600 km s−1 which exceed OH 231.8+4.2’s ∼200 km s−1, only toward CK Vul an extended well-developed bipolar outflow has been discovered. We note that both for OH 231.8+4.2 and CK Vul, shocked ionized material has been found in their outflows (Reipurth 1987; Hajduk et al. 2007)
We note that the RN events for V838 Mon and V1309 Sco occurred in 2002 and 2008, respectively. This is too short a time for an angularly extended outflow to develop, given the distances characterizing these objects, which have been estimated as 3.7 and 5.6 kpc, respectively (Tylenda et al. 2011; Ortiz-León et al. 2020). In contrast, the CK Vul merger happened in 1670, while a dynamical age of 800 years has been estimated for the CO outflow in OH 231.8+4.2 (Sanchez Contreras et al. 2022).
To summarize the results of the present study, we find that many of the characteristics of the emission observed toward OH 231.8+4.2 closely resemble what is found toward RNe. Apart from the bipolarity and their content in sulfur-bearing molecules, OH 231.8+4.2 and the merger sources Orion I and CK Vul share other chemical characteristics. Toward CK Vul, several metal-bearing molecules were discovered, namely, NaCl and KCl. They had first been discovered toward the high mass-loss carbon-rich AGB star IRC+10216, but not in other AGB objects. Recent sensitive ALMA observations have found these species in a compact circumbinary disk in OH 231.8+4.2 Sánchez Contreras et al. (2004) and in the disk in the Orion I (Ginsburg et al. 2019). Taken together, the discrepant velocity and it chemical peculiarities lend support to the hypothesis of Staff et al. (2016), namely, that OH 2381.8+4.2 is the result of a stellar merger.
6. Conclusion
This study presents a precise measurement of the distance to the protoplanetary nebula OH 231.8+4.2 (also known as the Rotten Egg or Calabash Nebula), using VLBI observations of H2O and SiO masers. These efforts yielded a trigonometric parallax of 0.65 ± 0.01 (stat) ± 0.02 (syst) mas, corresponding to a distance of 1.54 ± 0.05 kpc. This result agrees remarkably well with the Gaia EDR3-derived distance to the nearby open cluster M 46, confirming a physical association between the nebula and the cluster. However, the nebula exhibits a significant proper motion and radial velocity offset relative to M 46, suggesting it may be a dynamically disturbed object. Plausible explanations for these anomalies include: a past stellar merger, dynamical ejections, or a supernova explosion. Since the system most likely formed in the outskirts of the cluster, the dynamical ejection scenario seem unlikely. In addition, detailed modeling would be required to investigate whether the current binary system could have survived a supernova explosion of a former third star in the system. Although the aforementioned scenarios for the measured velocity difference cannot be ruled out solely based on current data, a stellar merger origin (as previously proposed) could explain the velocity offset, chemical peculiarities, and bipolar outflow seen in the system.
The National Radio Astronomy Observatory is a facility of the National Science Foundation operated under cooperative agreement by Associated Universities, Inc.
This work made use of the Swinburne University of Technology software correlator, developed as part of the Australian Major National Research Facilities Programme and operated under licence.
Acknowledgments
This research made use of hips2fits, (https://alasky.cds.unistra.fr/hips-image-services/hips2fits) a service provided by CDS. We thank the anonymous referee for helpful suggestions which improved this manuscript.
References
- Alcolea, J., Bujarrabal, V., Sánchez Contreras, C., Neri, R., & Zweigle, J. 2001, A&A, 373, 932 [NASA ADS] [CrossRef] [EDP Sciences] [Google Scholar]
- Bally, J., & Zinnecker, H. 2005, AJ, 129, 2281 [NASA ADS] [CrossRef] [Google Scholar]
- Blaauw, A. 1961, Bull. Astron. Inst. Netherlands, 15, 265 [NASA ADS] [Google Scholar]
- Brunthaler, A., Reid, M. J., & Falcke, H. 2005, Future Directions in High Resolution Astronomy, 340, 455 [Google Scholar]
- Brunthaler, A., Reid, M. J., Menten, K. M., et al. 2011, Astron. Nachr., 332, 461 [Google Scholar]
- Bujarrabal, V., Alcolea, J., Sánchez Contreras, C., et al. 2002, A&A, 389, 271 [NASA ADS] [CrossRef] [EDP Sciences] [Google Scholar]
- Cantat-Gaudin, T., & Anders, F. 2020, A&A, 633, A99 [NASA ADS] [CrossRef] [EDP Sciences] [Google Scholar]
- Cantat-Gaudin, T., & Brandt, T. D. 2021, A&A, 649, A124 [NASA ADS] [CrossRef] [EDP Sciences] [Google Scholar]
- Cantat-Gaudin, T., Jordi, C., Vallenari, A., et al. 2018, A&A, 618, A93 [NASA ADS] [CrossRef] [EDP Sciences] [Google Scholar]
- Choi, Y. K., Hirota, T., Honma, M., et al. 2008, PASJ, 60, 1007 [NASA ADS] [Google Scholar]
- Chrimes, A. A., Levan, A. J., Eldridge, J. J., et al. 2023, MNRAS, 522, 2029 [Google Scholar]
- de Mink, S. E., Sana, H., Langer, N., et al. 2014, ApJ, 782, 7 [CrossRef] [Google Scholar]
- Deguchi, S., Matsunaga, N., & Fukushi, H. 2005, PASJ, 57, L25 [NASA ADS] [Google Scholar]
- Deller, A. T., Tingay, S. J., Bailes, M., & West, C. 2007, PASP, 119, 318 [Google Scholar]
- Desmurs, J.-F., Alcolea, J., Bujarrabal, V., et al. 2007, A&A, 468, 189 [NASA ADS] [CrossRef] [EDP Sciences] [Google Scholar]
- Dodson, R., Rioja, M., Bujarrabal, V., et al. 2018, MNRAS, 476, 520 [Google Scholar]
- Eldridge, J. J., Langer, N., & Tout, C. A. 2011, MNRAS, 414, 3501 [NASA ADS] [CrossRef] [Google Scholar]
- Fabricius, C., Luri, X., Arenou, F., et al. 2021, A&A, 649, A5 [NASA ADS] [CrossRef] [EDP Sciences] [Google Scholar]
- Feast, M. W., Catchpole, R. M., Whitelock, P. A., Roberts, G., Jones, J. S., & Carter, B. S. 1983, MNRAS, 203, 1207 [Google Scholar]
- Fomalont, E., Petrov, L., McMillan, D. S., Gordon, D., & Ma, C. 2003, AJ, 126, 2562 [NASA ADS] [CrossRef] [Google Scholar]
- Frinchaboy, P. M., & Majewski, S. R. 2008, AJ, 136, 118 [NASA ADS] [CrossRef] [Google Scholar]
- Gaia Collaboration (Babusiaux, C., et al.) 2018, A&A, 616, A10 [NASA ADS] [CrossRef] [EDP Sciences] [Google Scholar]
- Ginsburg, A., McGuire, B., Plambeck, R., et al. 2019, ApJ, 872, 54 [NASA ADS] [CrossRef] [Google Scholar]
- Gómez, L., Rodríguez, L. F., Loinard, L., et al. 2008, ApJ, 685, 333 [CrossRef] [Google Scholar]
- Goss, W. M., Nguyen-Quang-Rieu, Winnberg, A., et al. 1973, A&A, 29, 435 [Google Scholar]
- Hajduk, M., Zijlstra, A. A., van Hoof, P. A. M., et al. 2007, MNRAS, 378, 1298 [CrossRef] [Google Scholar]
- Huang, Y., Yuan, H., Beers, T. C., et al. 2021, ApJ, 910, L5 [NASA ADS] [CrossRef] [Google Scholar]
- Hunt, E. L., & Reffert, S. 2023, A&A, 673, A114 [NASA ADS] [CrossRef] [EDP Sciences] [Google Scholar]
- Imai, H., Sahai, R., & Morris, M. 2007, ApJ, 669, 424 [Google Scholar]
- Jura, M., & Morris, M. 1985, ApJ, 292, 487 [NASA ADS] [CrossRef] [Google Scholar]
- Kalari, V. M., Vink, J. S., de Wit, W. J., et al. 2019, A&A, 625, L2 [NASA ADS] [CrossRef] [EDP Sciences] [Google Scholar]
- Kamiński, T., Menten, K. M., Tylenda, R., et al. 2015, Nature, 520, 322 [CrossRef] [Google Scholar]
- Kamiński, T., Menten, K. M., Tylenda, R., et al. 2017, A&A, 607, A78 [NASA ADS] [CrossRef] [EDP Sciences] [Google Scholar]
- Kamiński, T., Tylenda, R., Menten, K. M., et al. 2018, Nat. Astron., 2, 778 [CrossRef] [Google Scholar]
- Kamiński, T., Menten, K. M., Tylenda, R., et al. 2020, A&A, 644, A59 [NASA ADS] [CrossRef] [EDP Sciences] [Google Scholar]
- Kamiński, T., Steffen, W., Bujarrabal, V., et al. 2021, A&A, 646, A1 [NASA ADS] [CrossRef] [EDP Sciences] [Google Scholar]
- Kastner, J. H., Weintraub, D. A., Zuckerman, B., & Becklin, E. E. 1992, ApJ, 398, 552 [NASA ADS] [CrossRef] [Google Scholar]
- Kastner, J. H., Weintraub, D. A., Merrill, K. M., & Gatley, I. 1998, AJ, 116, 1412 [Google Scholar]
- Kettenis, M., van Langevelde, H. J., Reynolds, C., & Cotton, B. 2006, ASP Conf. Ser., 351, 497 [NASA ADS] [Google Scholar]
- Kiss, L. L., Szabó, G. M., Balog, Z., et al. 2008, MNRAS, 391, 399 [Google Scholar]
- Leal-Ferreira, M. L., Vlemmings, W. H. T., Diamond, P. J., et al. 2012, A&A, 540A, 42 [Google Scholar]
- Lennon, D. J., Evans, C. J., van der Marel, R. P., et al. 2018, A&A, 619, A78 [NASA ADS] [CrossRef] [EDP Sciences] [Google Scholar]
- Leung, H. W., Bovy, J., Mackereth, J. T., et al. 2023, MNRAS, 519, 948 [Google Scholar]
- Lindegren, L., Lammers, U., Hobbs, D., et al. 2012, A&A, 538, A78 [NASA ADS] [CrossRef] [EDP Sciences] [Google Scholar]
- Lindegren, L., Klioner, S. A., Hernández, J., et al. 2021a, A&A, 649, A2 [EDP Sciences] [Google Scholar]
- Lindegren, L., Bastian, U., Biermann, M., et al. 2021b, A&A, 649, A4 [EDP Sciences] [Google Scholar]
- Ma, C., Arias, E. F., Bianco, G., et al. 2009, IERS Technical Note, 35, 1 [Google Scholar]
- Menten, K. M., & Reid, M. J. 1995, ApJ, 445, L157 [Google Scholar]
- Morris, M., & Bowers, P. F. 1980, AJ, 85, 724 [Google Scholar]
- Morris, M., Guilloteau, S., Lucas, R., et al. 1987, ApJ, 321, 888 [NASA ADS] [CrossRef] [Google Scholar]
- Nakagawa, A., Kurayama, T., Matsui, M., et al. 2016, PASJ, 68, 78 [Google Scholar]
- Oh, S., & Kroupa, P. 2016, A&A, 590, A107 [NASA ADS] [CrossRef] [EDP Sciences] [Google Scholar]
- Ortiz-León, G. N., Menten, K. M., Kamiński, T., et al. 2020, A&A, 638, A17 [NASA ADS] [CrossRef] [EDP Sciences] [Google Scholar]
- Petrov, L., Kovalev, Y. Y., Fomalont, E., & Gordon, D. 2005, AJ, 129, 1163 [NASA ADS] [CrossRef] [Google Scholar]
- Petrov, L., Kovalev, Y. Y., Fomalont, E., & Gordon, D. 2006, AJ, 131, 1872 [NASA ADS] [CrossRef] [Google Scholar]
- Poveda, A., Ruiz, J., & Allen, C. 1967, Bol. Obs. Tonantzintla y Tacubaya, 4, 86 [Google Scholar]
- Reid, M. J., & Menten, K. M. 1990, ApJ, 360, L51 [Google Scholar]
- Reid, M. J., & Menten, K. M. 2007, ApJ, 671, 2068 [NASA ADS] [CrossRef] [Google Scholar]
- Reid, M. J., Menten, K. M., Brunthaler, A., Zheng, X. W., Moscadelli, L., & Xu, Y. 2009a, ApJ, 693, 397 [Google Scholar]
- Reid, M. J., Menten, K. M., Zheng, X. W., et al. 2009b, ApJ, 700, 137 [CrossRef] [Google Scholar]
- Reid, M. J., Menten, K. M., Brunthaler, A., et al. 2014, ApJ, 783, 130 [Google Scholar]
- Reid, M. J., Brunthaler, A., Menten, K. M., et al. 2017, AJ, 154, 63 [NASA ADS] [CrossRef] [Google Scholar]
- Reipurth, B. 1987, Nature, 325, 787 [Google Scholar]
- Renzo, M., Zapartas, E., de Mink, S. E., et al. 2019, A&A, 624, A66 [NASA ADS] [CrossRef] [EDP Sciences] [Google Scholar]
- Sánchez Contreras, C., Gil de Paz, A., & Sahai, R. 2004, ApJ, 616, 519 [CrossRef] [Google Scholar]
- Sánchez Contreras, C., Velilla Prieto, L., Agúndez, M., et al. 2015, A&A, 577, A52 [NASA ADS] [CrossRef] [EDP Sciences] [Google Scholar]
- Sánchez Contreras, C., Alcolea, J., Bujarrabal, V., et al. 2018, A&A, 618, A164 [NASA ADS] [CrossRef] [EDP Sciences] [Google Scholar]
- Sanchez Contreras, C., Alcolea, J., Rodriguez Cardoso, R., et al. 2022, A&A, 665, A88 [CrossRef] [EDP Sciences] [Google Scholar]
- Schönrich, R., Binney, J., & Dehnen, W. 2010, MNRAS, 403, 1829 [NASA ADS] [CrossRef] [Google Scholar]
- Soker, N., & Kashi, A. 2012, ApJ, 746, 100 [NASA ADS] [CrossRef] [Google Scholar]
- Soker, N., & Tylenda, R. 2003, ApJ, 582, L105 [NASA ADS] [CrossRef] [Google Scholar]
- Staff, J. E., De Marco, O., Macdonald, D., et al. 2016, MNRAS, 455, 3511 [NASA ADS] [CrossRef] [Google Scholar]
- Tafoya, D., Imai, H., Gómez, Y., et al. 2011, PASJ, 63, 71 [Google Scholar]
- Tarricq, Y., Soubiran, C., Casamiquela, L., et al. 2021, A&A, 647, A19 [NASA ADS] [CrossRef] [EDP Sciences] [Google Scholar]
- Tarter, T. C., & Welch, W. J. 1986, ApJ, 305, 467 [Google Scholar]
- Turner, B. E. 1971, Astrophys. Lett., 8, 73 [NASA ADS] [Google Scholar]
- Tylenda, R., Hajduk, M., Kamiński, T., et al. 2011, A&A, 528, A114 [NASA ADS] [CrossRef] [EDP Sciences] [Google Scholar]
- VERA Collaboration (Hirota, T., et al.) 2020, PASJ, 72, 50 [Google Scholar]
- Vlemmings, W. H. T., Diamond, P. J., & Imai, H. 2006, Nature, 440, 58 [Google Scholar]
- Zhang, B., Reid, M. J., Menten, K. M., & Zheng, X. W. 2012a, ApJ, 744, 23 [NASA ADS] [CrossRef] [Google Scholar]
- Zhang, B., Reid, M. J., Menten, K. M., Zheng, X. W., & Brunthaler, A. 2012b, A&A, 544, A42 [NASA ADS] [CrossRef] [EDP Sciences] [Google Scholar]
All Tables
All Figures
|
Fig. 1. Spectra of the H2O masers toward OH 231.8+4.2 produced by scalar averaging the data over all time and baseline. Four different lines represent different epochs. |
| In the text | |
|
Fig. 2. Spatial distribution of the H2O masers in OH 231.8+4.2 at all epochs (top left: 1; top right: 2; bottom left: 3; bottom right: 4). The LSR velocities of the maser spots are indicated by the color bar to the right. The reference spot at VLSR = 25.52 km s−1 is located at (0,0). The blue and green stars in the bottom right map show the location of the SiO maser spots at 27.26 and 32.23 km s−1, respectively. |
| In the text | |
|
Fig. 3. Median separation between the northern and southern water maser cluster in the observations from Desmurs et al. (2007) shown as an open square, Leal-Ferreira et al. (2012) as a filled square, Dodson et al. (2018) as a blue x, and our own data as a green x. The blue line is a linear fit to all data. |
| In the text | |
|
Fig. 4. Parallax and proper motion fit for OH 231.8+4.2. For each plot, points with error bars are position measurements of the H2O maser spot at VLSR of 25.52 km s−1 relative to the background quasar J0746–1555. Left panel: Motion of the maser on the sky. Middle panel: Change of position eastward (solid line) and northward (dashed line) as a function of time. The northward data have been shifted downward for clarity. Right panel: Same as the middle panel after removing the best-fitting linear proper motion. |
| In the text | |
|
Fig. 5. Upper panel: Parallaxes of individual stars in M 46 plotted against the apparent G magnitude of the star. The horizontal line marks the average parallax. Lower panel: Same as the upper panel, but removing stars with astrometric_excess_noise_sig > 2. The average parallax changed by 8 μas. |
| In the text | |
|
Fig. 6. 2MASS color composite of M 46. The center of the open cluster is marked with an red X. OH 231.8+4.2 is also seen and its tangential motions derived from the water masers (cyan) and SiO masers (red) relative to M 46 are also shown. The yellow line marks the orientation of the large scale CO outflow. The white arrow in the bottom right corner corresponds to a tangential motion of 10 km s−1. |
| In the text | |
Current usage metrics show cumulative count of Article Views (full-text article views including HTML views, PDF and ePub downloads, according to the available data) and Abstracts Views on Vision4Press platform.
Data correspond to usage on the plateform after 2015. The current usage metrics is available 48-96 hours after online publication and is updated daily on week days.
Initial download of the metrics may take a while.