Open Access
Fig. 5.
Download original image
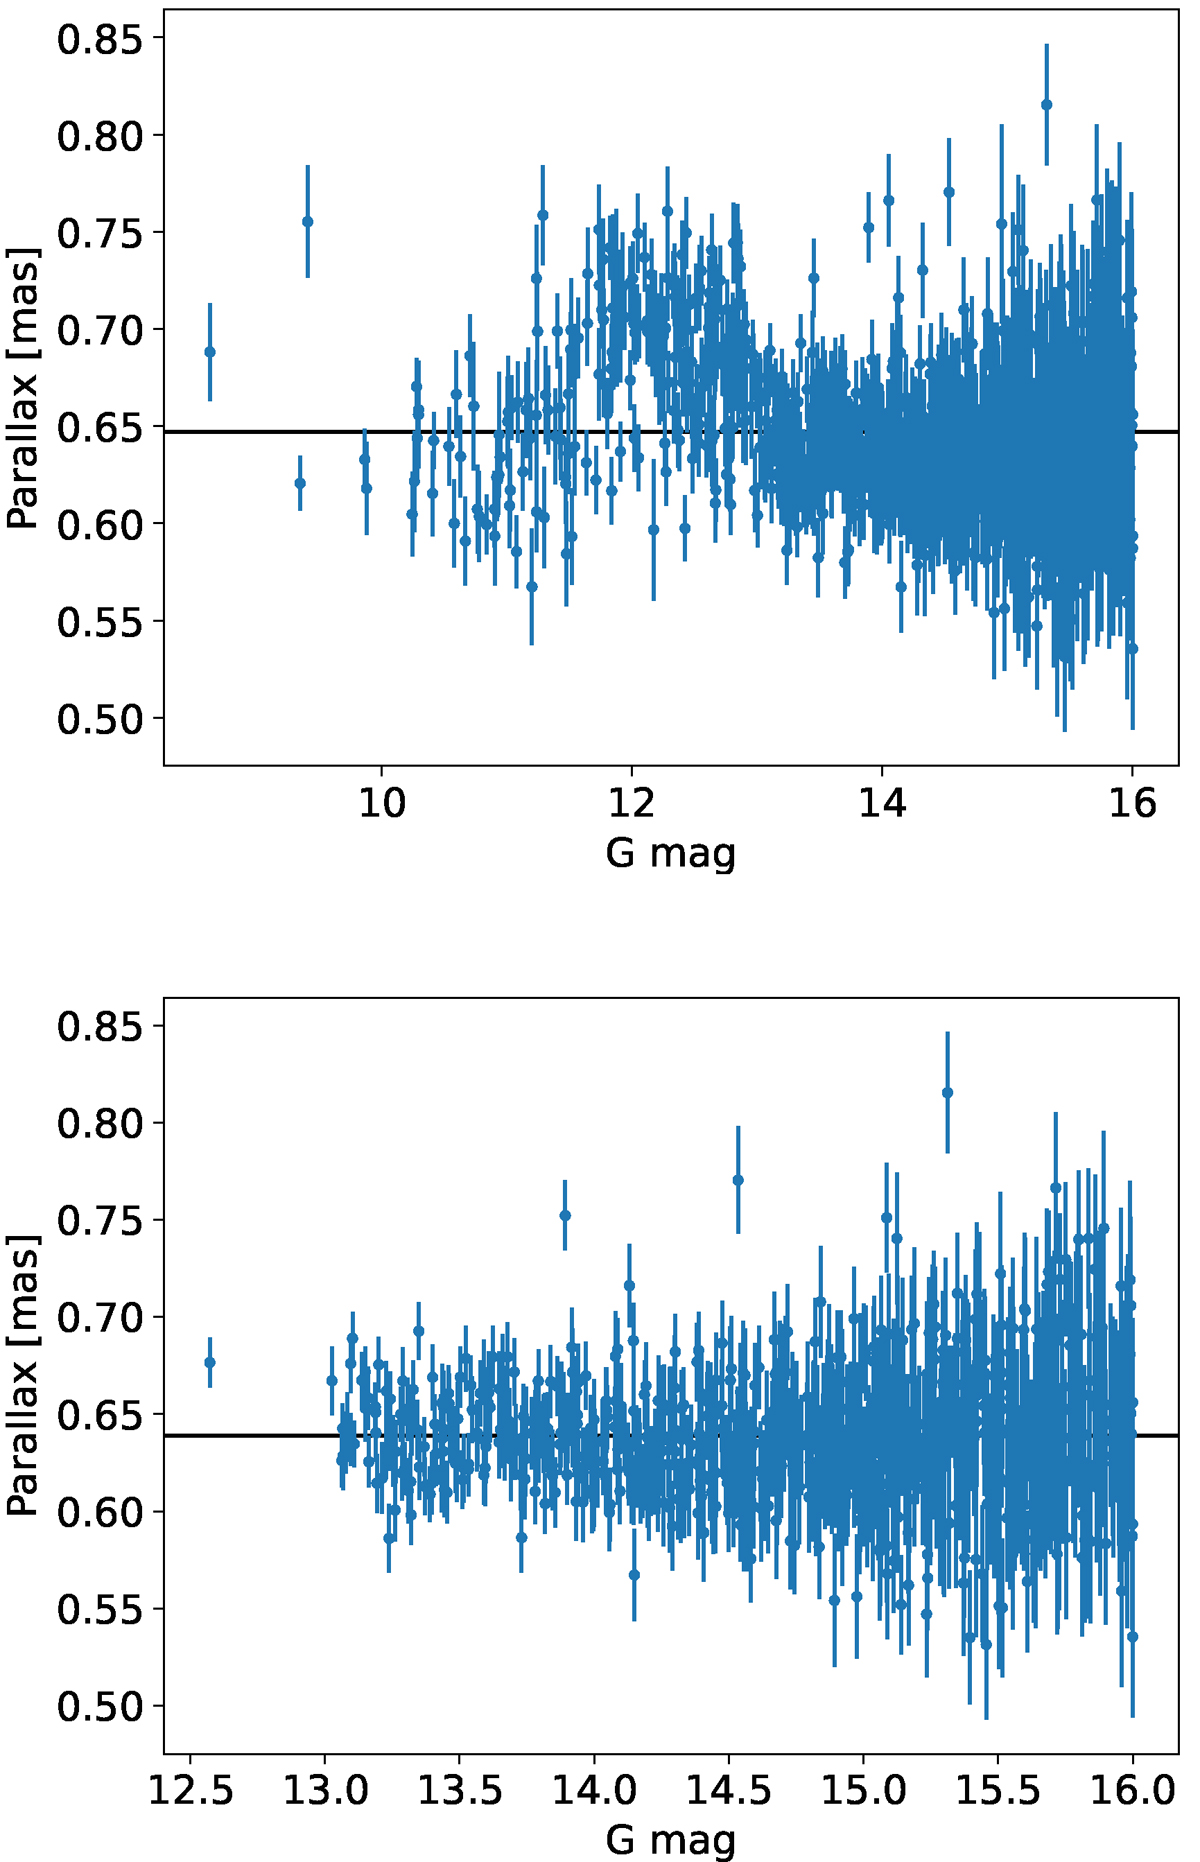
Upper panel: Parallaxes of individual stars in M 46 plotted against the apparent G magnitude of the star. The horizontal line marks the average parallax. Lower panel: Same as the upper panel, but removing stars with astrometric_excess_noise_sig > 2. The average parallax changed by 8 μas.
Current usage metrics show cumulative count of Article Views (full-text article views including HTML views, PDF and ePub downloads, according to the available data) and Abstracts Views on Vision4Press platform.
Data correspond to usage on the plateform after 2015. The current usage metrics is available 48-96 hours after online publication and is updated daily on week days.
Initial download of the metrics may take a while.