Fig. 2
Download original image
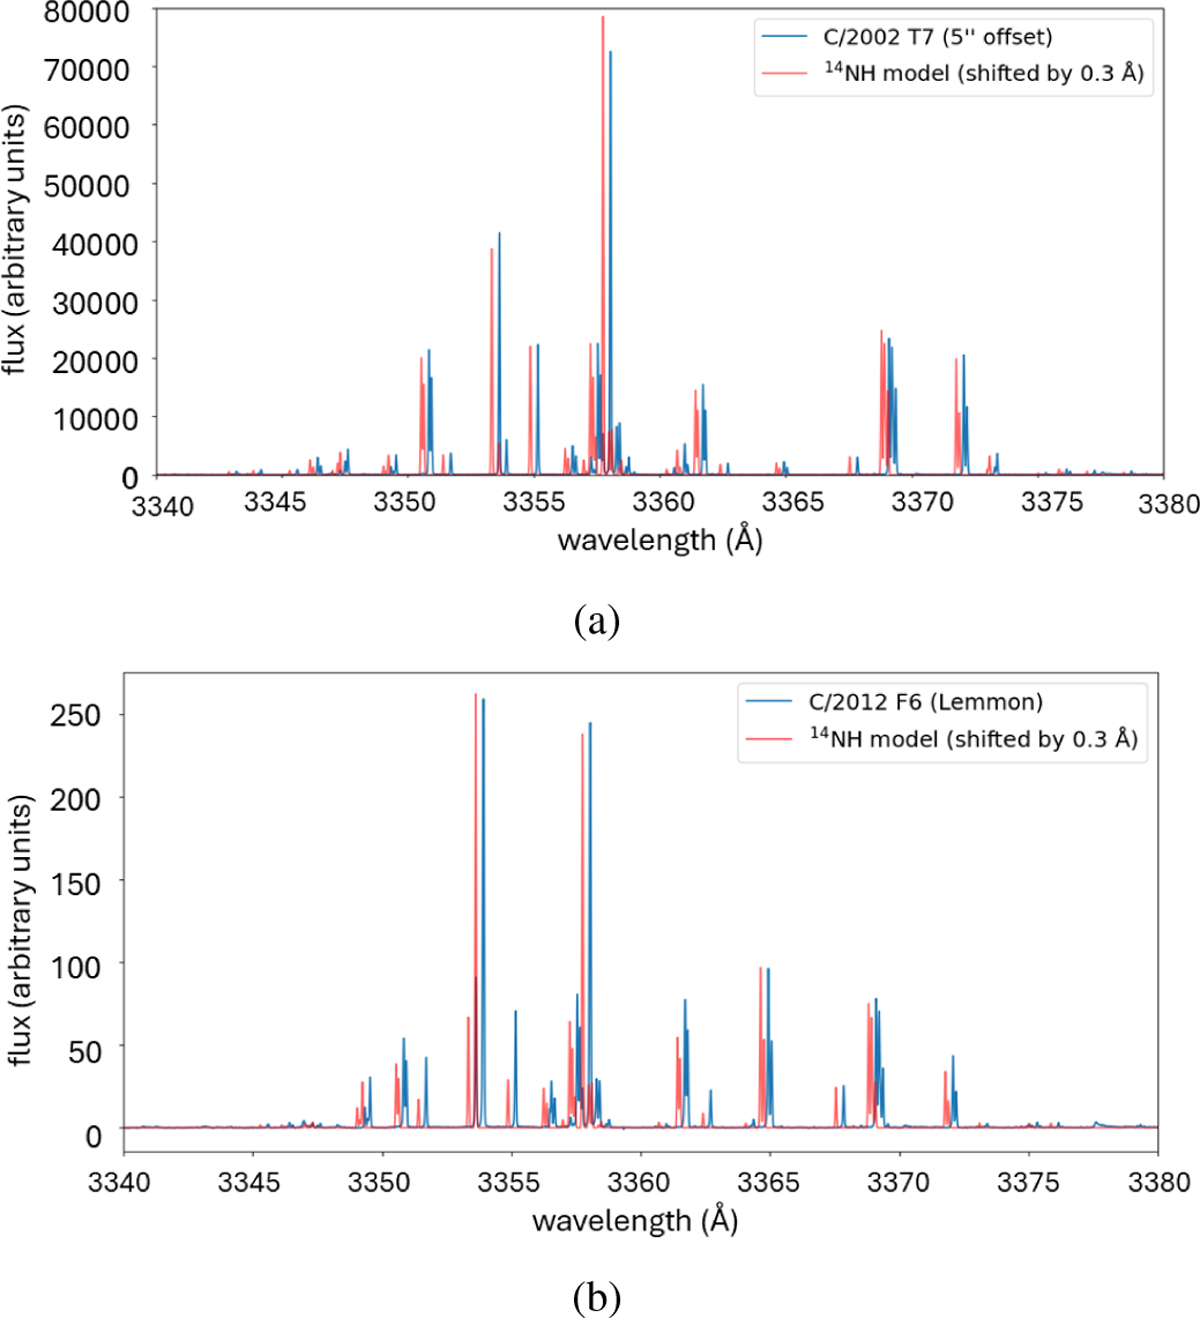
14NH model compared to observed cometary spectra. The modeled spectra have been shifted by 0.3 Å to the left for clarity. Note that the prominent features of both the observed and the modeled spectra are the (0–0) band, but some weak lines of the (1–1) and (2–2) bands are also present in the 3340–3380 Å wavelength range. (a) Comparison between the modeled NH A3Πi − X3Σ− (0–0) band (red) and the observational spectrum of Comet C/2002 T7 (LINEAR) (blue) at a heliocentric distance of Rh = 0.680 au and a heliocentric velocity of ![]() = 15.8 km s−1. (b) Comparison between the modeled NH A3Πi − X3Σ− (0–0) band (red) and the observational spectrum of Comet C/2012 F6 (Lemmon) (blue) at a heliocentric distance of Rh = 1.175 au and a heliocentric velocity of
= 15.8 km s−1. (b) Comparison between the modeled NH A3Πi − X3Σ− (0–0) band (red) and the observational spectrum of Comet C/2012 F6 (Lemmon) (blue) at a heliocentric distance of Rh = 1.175 au and a heliocentric velocity of ![]() = −23.9 km s−1.
= −23.9 km s−1.
Current usage metrics show cumulative count of Article Views (full-text article views including HTML views, PDF and ePub downloads, according to the available data) and Abstracts Views on Vision4Press platform.
Data correspond to usage on the plateform after 2015. The current usage metrics is available 48-96 hours after online publication and is updated daily on week days.
Initial download of the metrics may take a while.