Fig. 3
Download original image
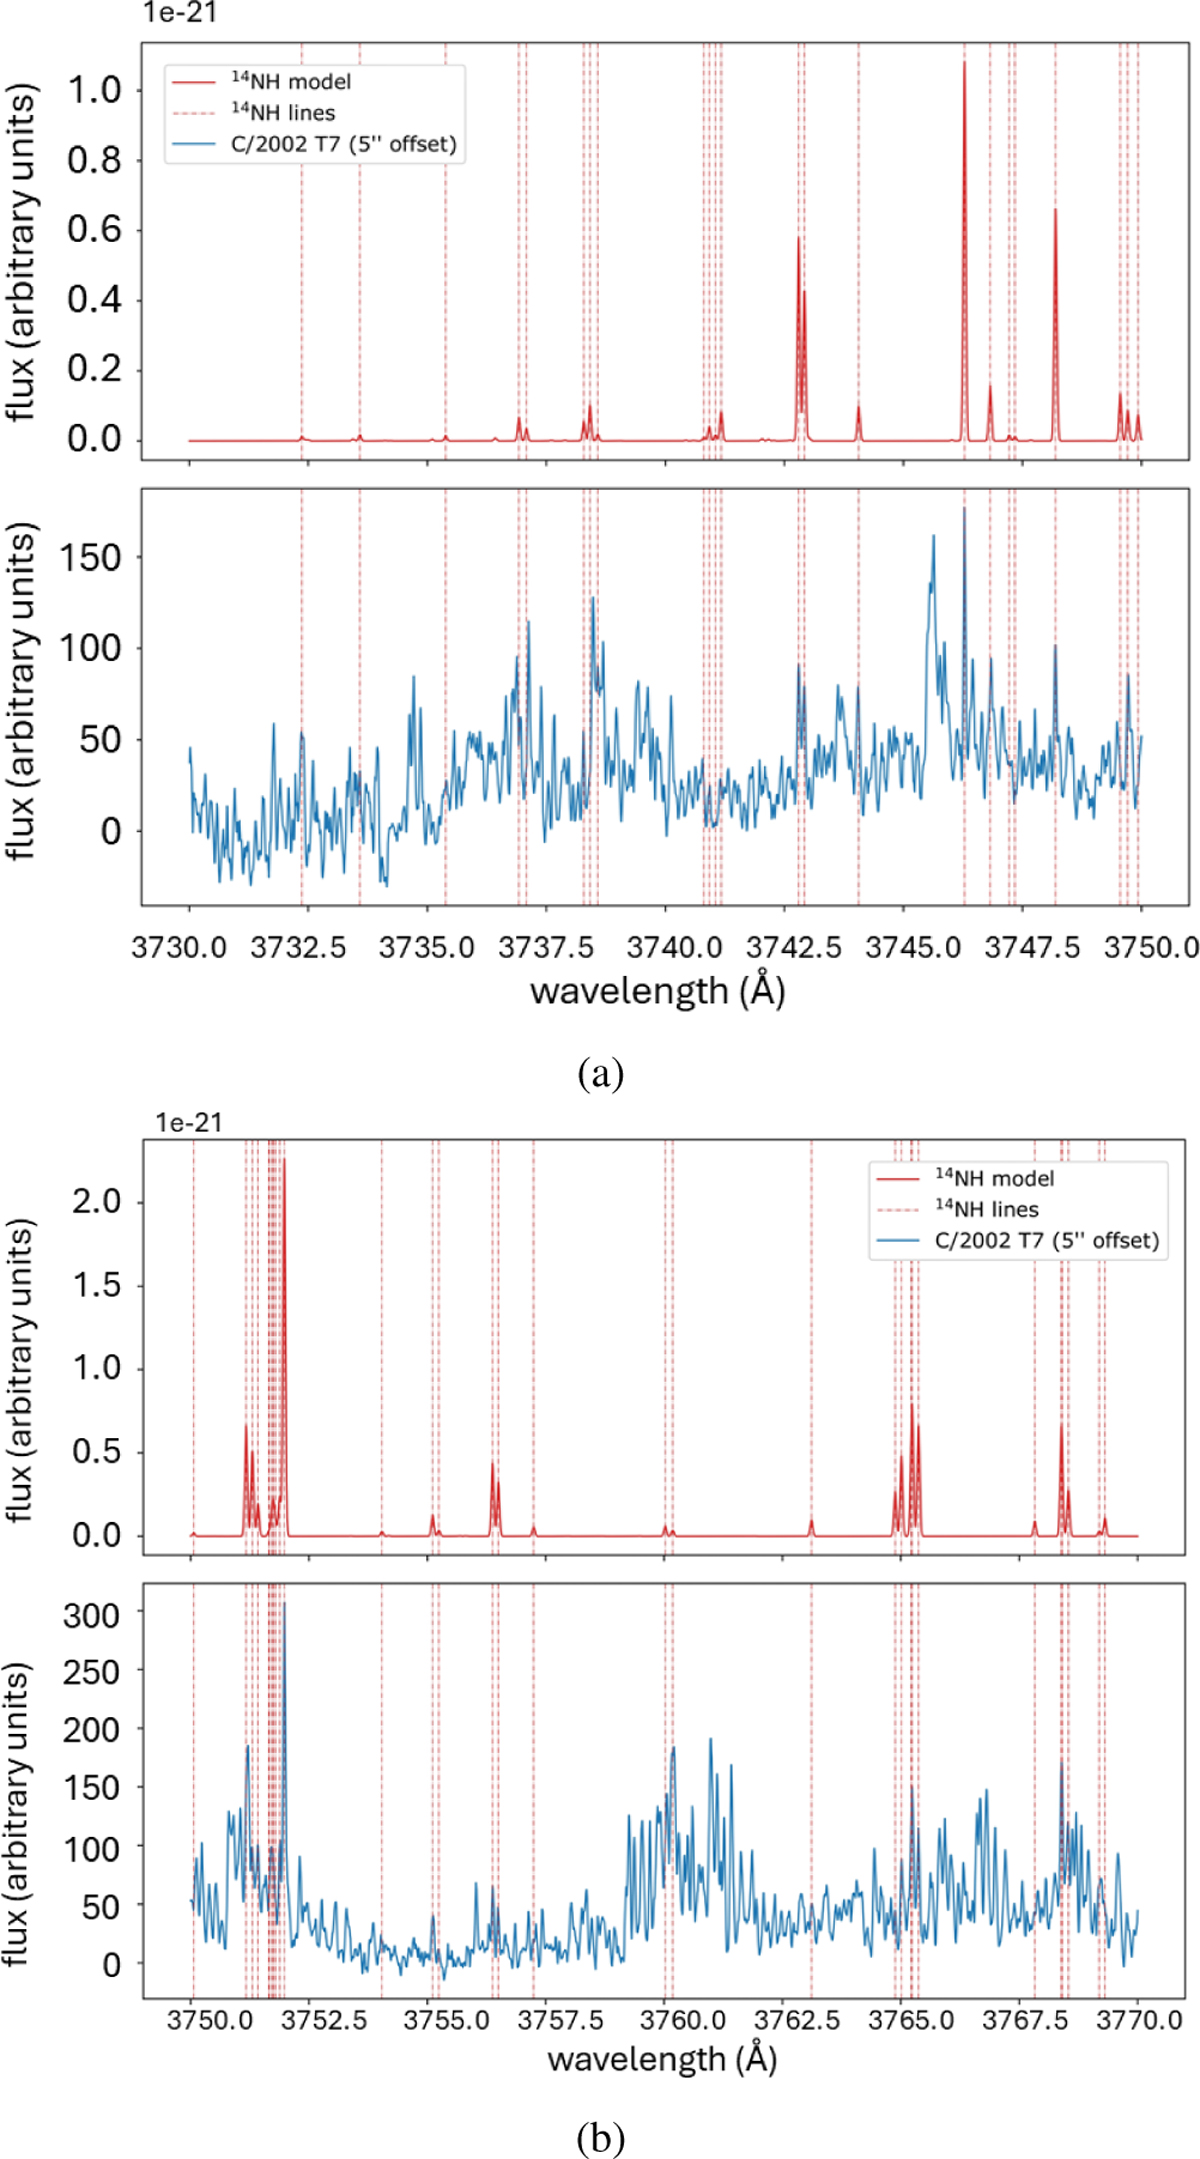
New identification of the weak 14NH A3Πi − X3Σ−(0–1) band (red) in the observed spectrum of T7 (blue). Individual modeled emission lines of the (0–1) band are represented by the dashed red lines. (a) The most intense 14NH lines in the spectral region 3730–3750 Å are identified in the observed spectrum of T7. (b) The most intense 14NH lines in the spectral region 3750–3770 Å are identified in the observed spectrum of T7.
Current usage metrics show cumulative count of Article Views (full-text article views including HTML views, PDF and ePub downloads, according to the available data) and Abstracts Views on Vision4Press platform.
Data correspond to usage on the plateform after 2015. The current usage metrics is available 48-96 hours after online publication and is updated daily on week days.
Initial download of the metrics may take a while.