Open Access
Fig. 8
Download original image
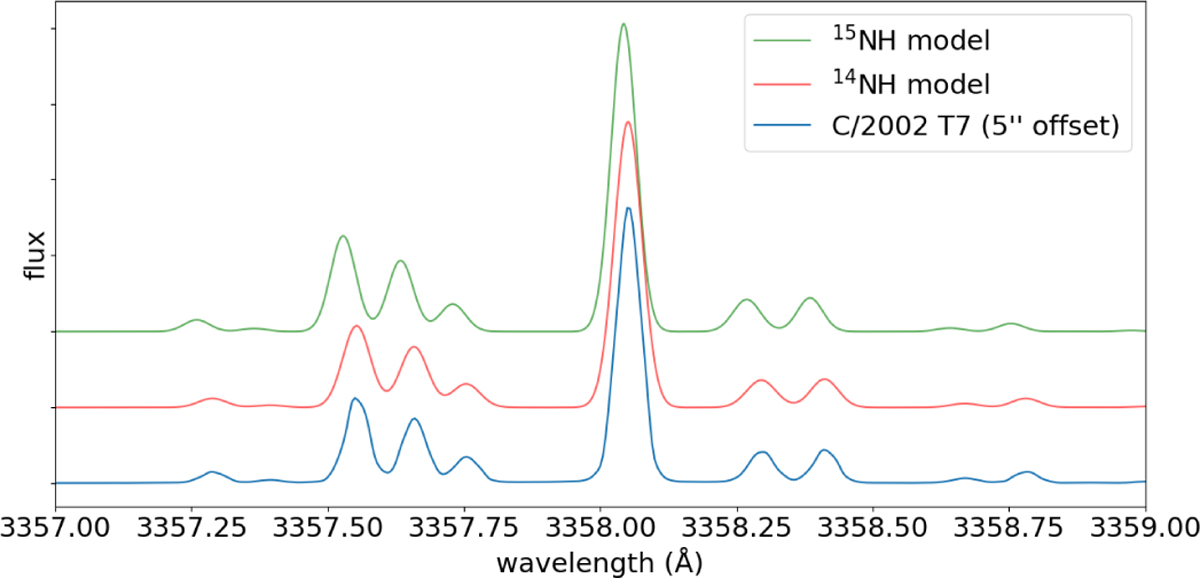
Zoom on the most intense 14NH and 15NH line of the (0–0) band at 3358 Å. Both modeled spectra have been shifted to higher fluxes in order to visualize the small wavelengths shift between the 15NH and 14NH lines (therefore, no flux values are given).
Current usage metrics show cumulative count of Article Views (full-text article views including HTML views, PDF and ePub downloads, according to the available data) and Abstracts Views on Vision4Press platform.
Data correspond to usage on the plateform after 2015. The current usage metrics is available 48-96 hours after online publication and is updated daily on week days.
Initial download of the metrics may take a while.