Fig. 9
Download original image
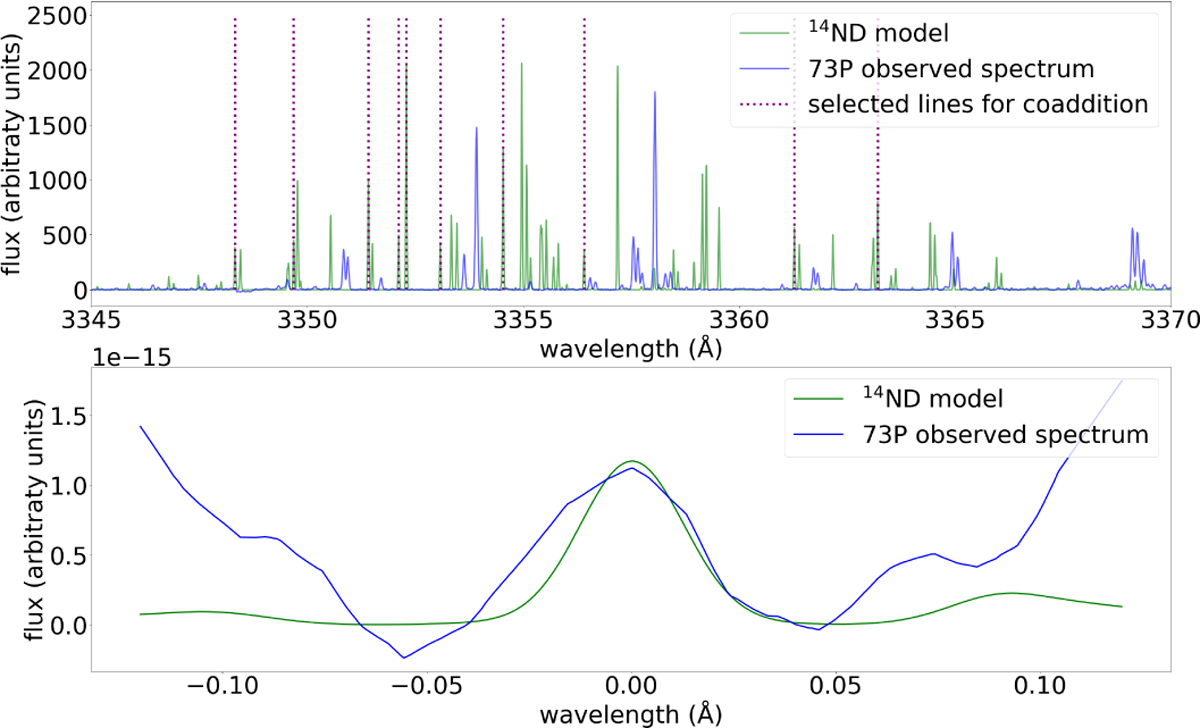
Coaddition of 14ND lines. Top panel: 14ND lines selected for coaddition are indicated by vertical, dotted, purple lines listed in Table 6. The modeled 14ND spectrum in green has been intensified to have a flux similar to the observed spectrum of 73P in blue. Notice that some of the most intense lines of the 14ND modeled spectrum have not been selected for the coaddition, as they were blended with 14NH lines. Bottom panel: result of the coaddition of the 14ND lines of the observed spectrum of 73P in blue and the modeled 14ND lines in green.
Current usage metrics show cumulative count of Article Views (full-text article views including HTML views, PDF and ePub downloads, according to the available data) and Abstracts Views on Vision4Press platform.
Data correspond to usage on the plateform after 2015. The current usage metrics is available 48-96 hours after online publication and is updated daily on week days.
Initial download of the metrics may take a while.