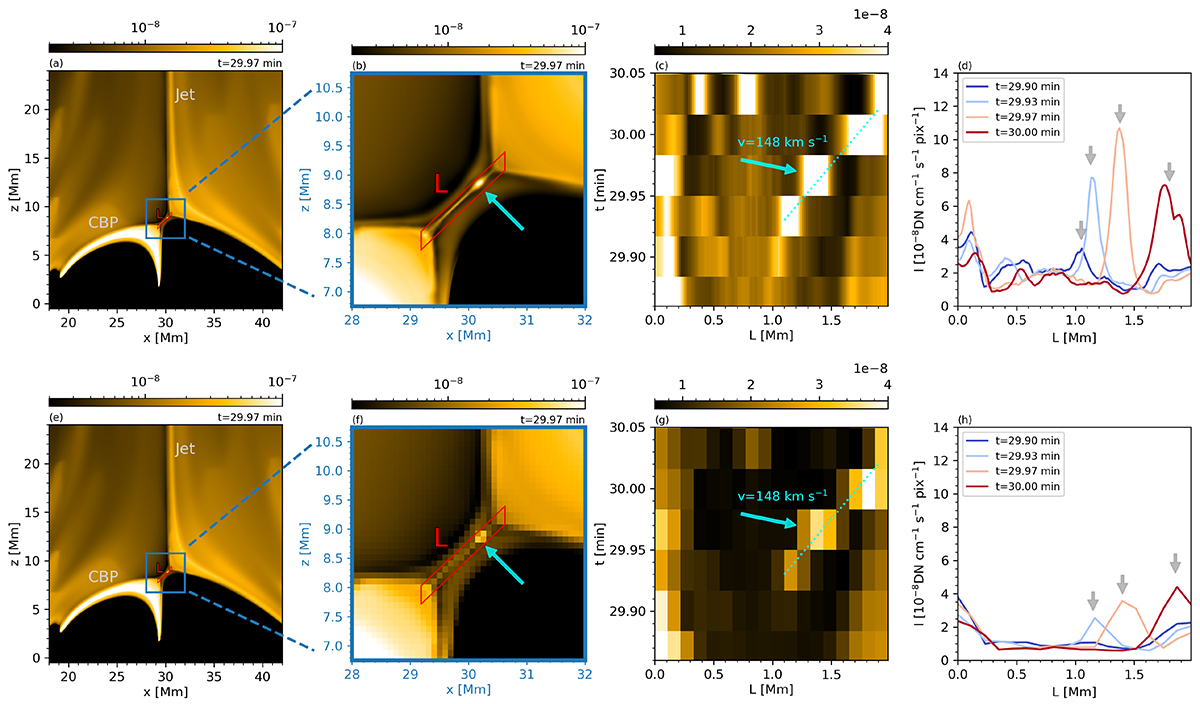
Fig. 4.
Download original image
Same as Figure 3, but for the plasmoid signatures in the 2D CBP simulation by Nóbrega-Siverio & Moreno-Insertis (2022). Top row shows the HRIEUV synthetic emissivity at the original resolution of the numerical experiment (≈16 km). Bottom row shows the results after degrading the resolution to match the best case achievable by HRIEUV in our study (pixel size of 108 km). An animation of this figure is available on zenodo and online, showcasing the plasmoid evolution between t = 29.9 and t = 30.0 min.
Current usage metrics show cumulative count of Article Views (full-text article views including HTML views, PDF and ePub downloads, according to the available data) and Abstracts Views on Vision4Press platform.
Data correspond to usage on the plateform after 2015. The current usage metrics is available 48-96 hours after online publication and is updated daily on week days.
Initial download of the metrics may take a while.