Fig. 5.
Download original image
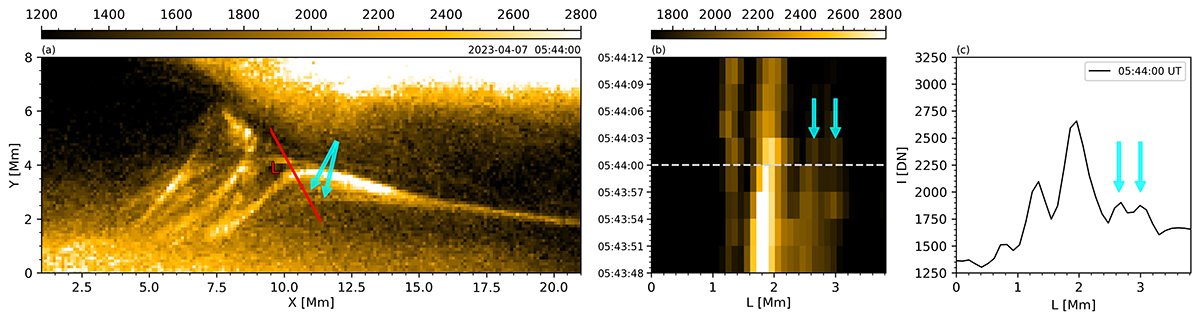
Indirect signatures of plasmoid-mediated reconnection in case 01. Panel a: Context view illustrating the CBP and the associated ejections. The arrows mark the signatures that are interpreted as consequences of plasmoid-mediated magnetic reconnection. Panel b: Space–time map obtained by sampling the intensity along the slit of length L shown in panel a. Panel c: Intensity profiles along the slit at 05:44:00 UT. An animation of this figure is available online, showing the time evolution between 05:43:48 UT and 05:44:12 UT.
Current usage metrics show cumulative count of Article Views (full-text article views including HTML views, PDF and ePub downloads, according to the available data) and Abstracts Views on Vision4Press platform.
Data correspond to usage on the plateform after 2015. The current usage metrics is available 48-96 hours after online publication and is updated daily on week days.
Initial download of the metrics may take a while.