Fig. 6.
Download original image
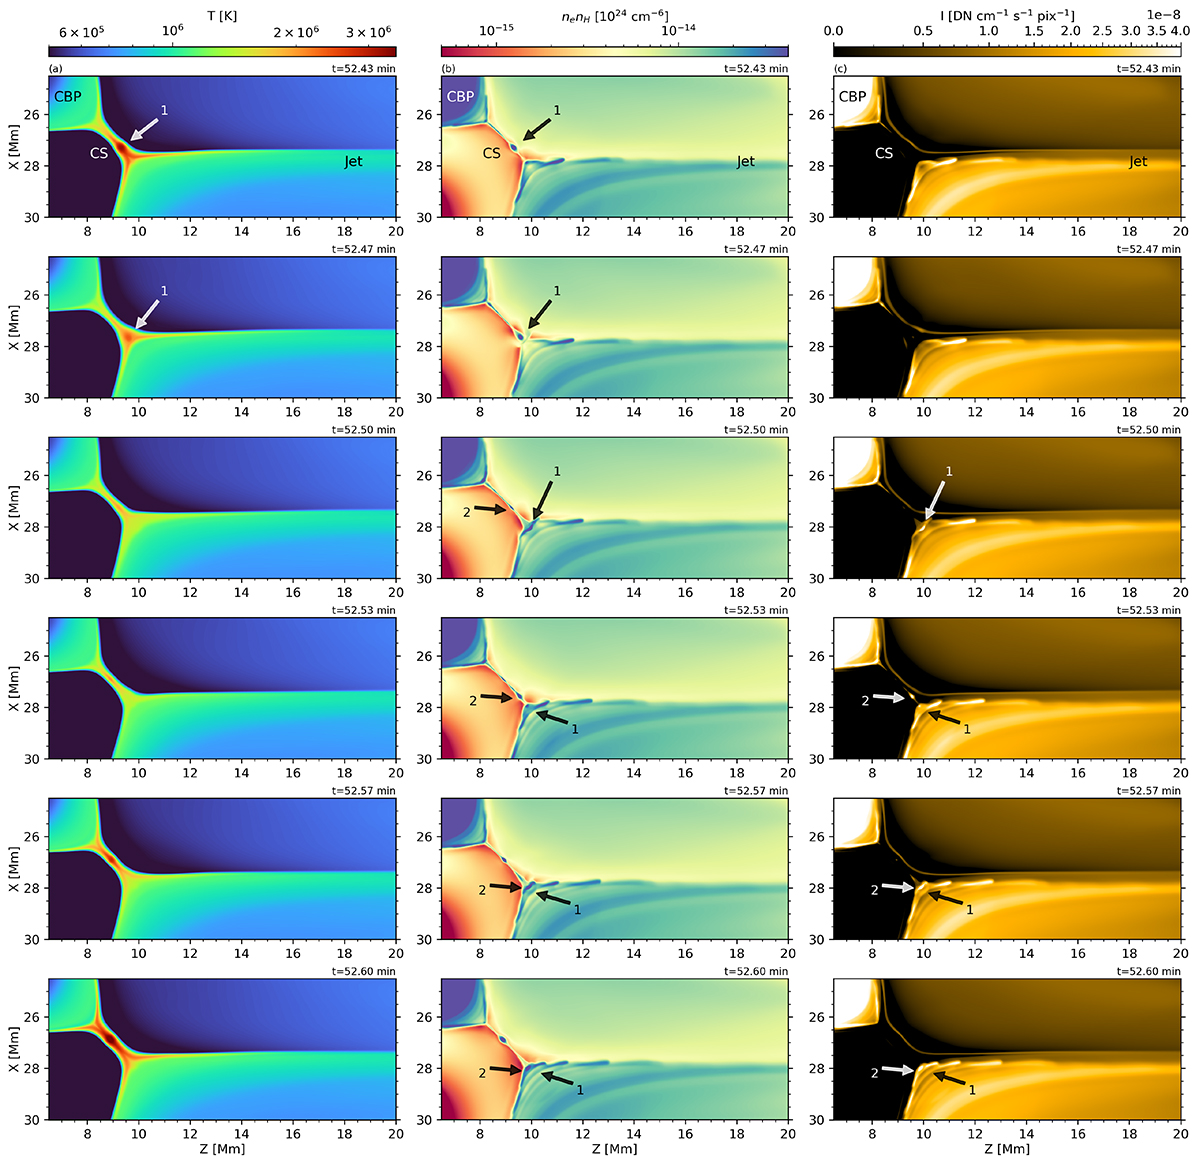
Indirect signatures of plasmoid-mediated reconnection in the outflow region from the 2D CBP simulation by Nóbrega-Siverio & Moreno-Insertis (2022) between t = 52.43 and t = 52.60 min. We have transposed the axes so that height appears on the horizontal axis to ease the comparison with the observations. Column (a): Temperature maps. Column (b): nenH, the product of the electron and hydrogen number densities. Column (c): HRIEUV synthetic emissivity at the original resolution of the experiment (≈16 km). The three panels of the top row include the locations of the CBP, the current sheet (CS), and the jet. The arrows 1 and 2 follow the formation and ejection of two different plasmoids along with their signatures in the outflow region.
Current usage metrics show cumulative count of Article Views (full-text article views including HTML views, PDF and ePub downloads, according to the available data) and Abstracts Views on Vision4Press platform.
Data correspond to usage on the plateform after 2015. The current usage metrics is available 48-96 hours after online publication and is updated daily on week days.
Initial download of the metrics may take a while.