Fig. 7.
Download original image
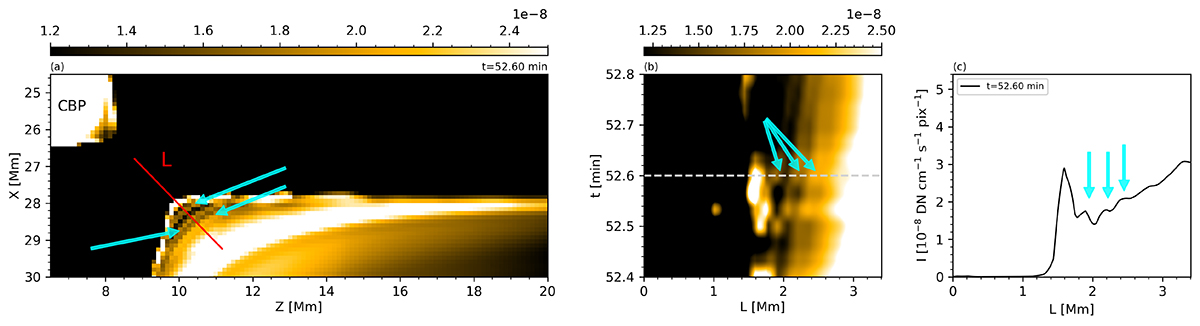
Indirect signatures of plasmoid-mediated reconnection in the outflow region from the 2D CBP simulation by Nóbrega-Siverio & Moreno-Insertis (2022) after degrading the resolution to match the best case achievable by HRIEUV in our study (pixel size of 108 km). Panel a: HRIEUV synthetic emissivity. We have transposed the axes so that height appears on the horizontal axis. Panel b: Space–time map obtained by sampling the intensity along the slit of length L shown in panel a. Panel c: Intensity profiles along the slit at t = 52.60 min. In all the panels, the arrows mark some of the features that are interpreted as consequences of plasmoids previously ejected during the reconnection process. An animation of this figure is available online, including temperature and nenH maps, showcasing the appearance of indirect plasmoid-mediated signatures between t = 52.40 and t = 52.80 min.
Current usage metrics show cumulative count of Article Views (full-text article views including HTML views, PDF and ePub downloads, according to the available data) and Abstracts Views on Vision4Press platform.
Data correspond to usage on the plateform after 2015. The current usage metrics is available 48-96 hours after online publication and is updated daily on week days.
Initial download of the metrics may take a while.