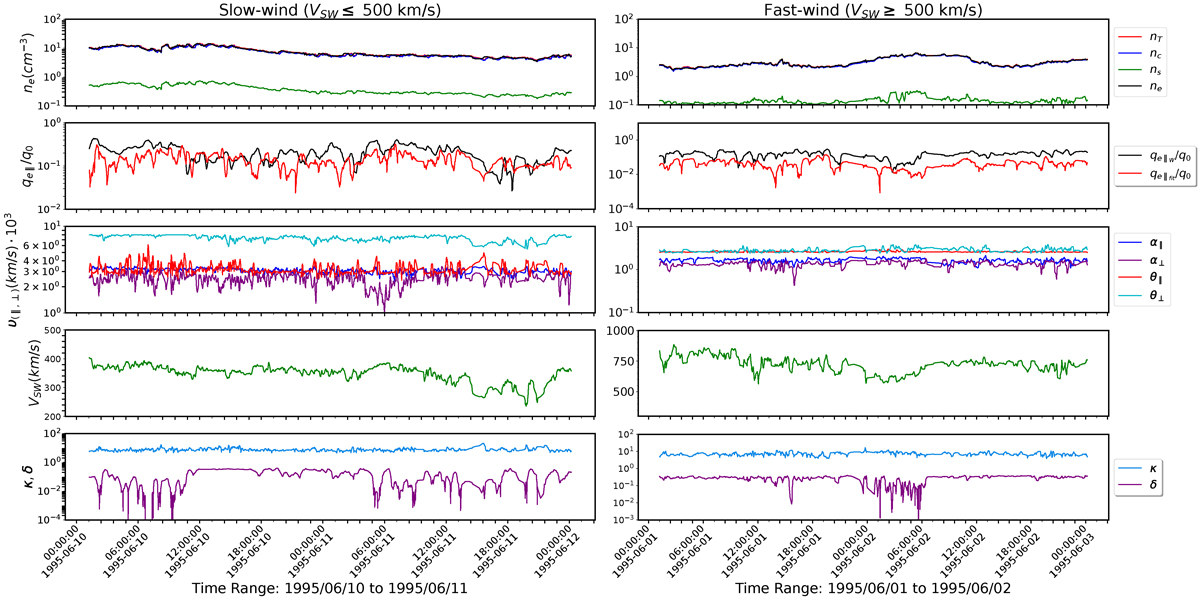
Fig. 2.
Download original image
Time series plots of solar wind and CS fit parameters. The left panels correspond to the slow solar wind observed on June 10, 1995, while the right panels correspond to the fast solar wind observed on June 1, 1995. The top panels for both fast and slow wind show the time series of densities (cm−3). The second panel from the top presents the time series of the heat flux. The third panel displays the time series of the thermal velocities. The fourth panel illustrates the solar wind speed. The bottom panel shows the time series of kappa and delta.
Current usage metrics show cumulative count of Article Views (full-text article views including HTML views, PDF and ePub downloads, according to the available data) and Abstracts Views on Vision4Press platform.
Data correspond to usage on the plateform after 2015. The current usage metrics is available 48-96 hours after online publication and is updated daily on week days.
Initial download of the metrics may take a while.