Fig. 3.
Download original image
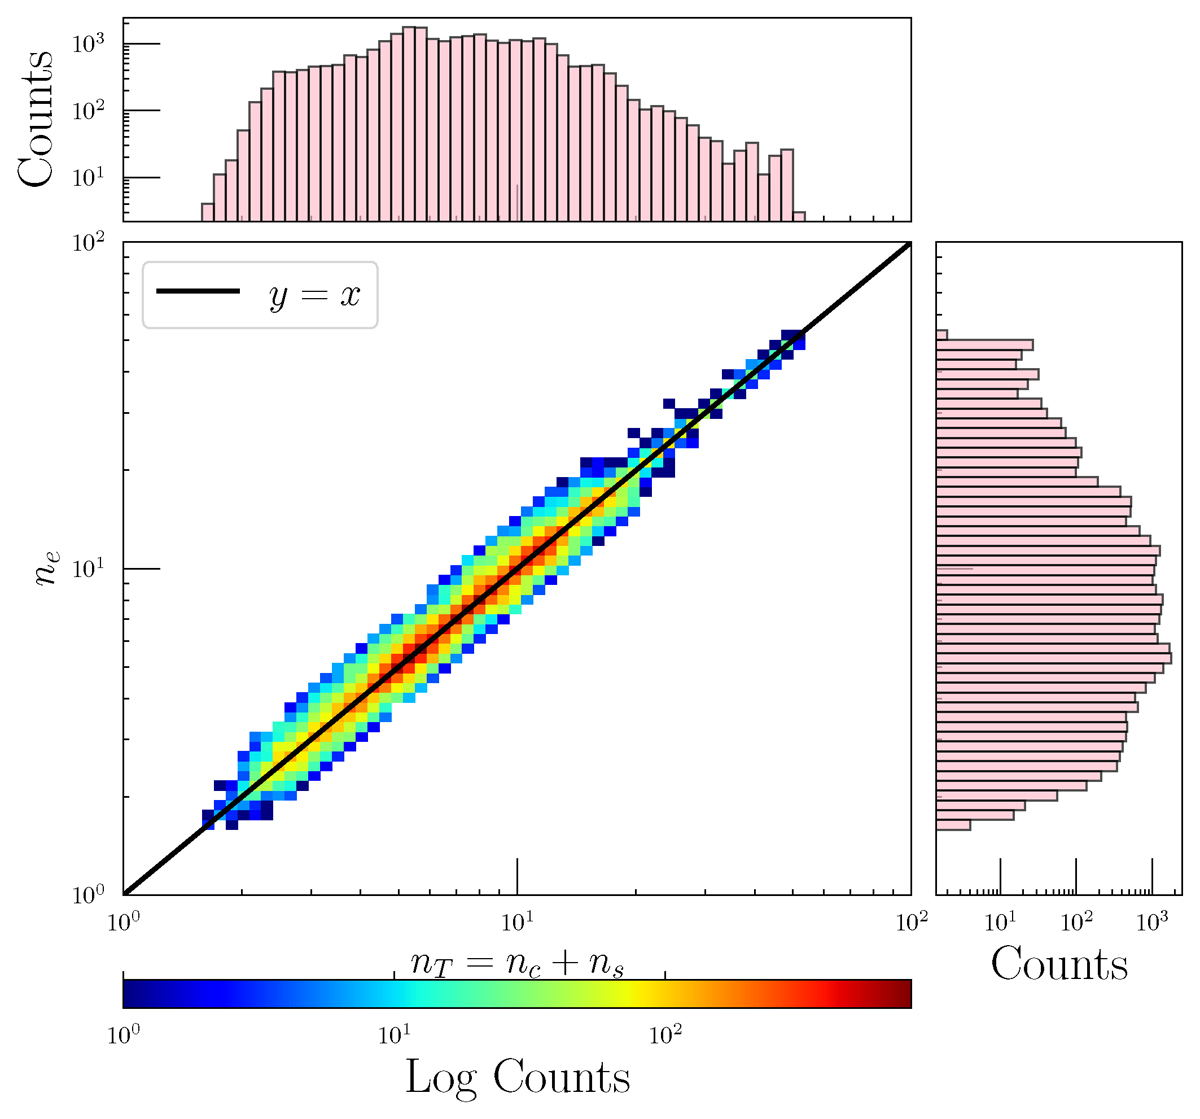
Joint (2D) histograms which compares the total electron density (nT = nc + ns) estimated from CS fits with the total moment electron density (ne), over a 50-day interval in 1995. The solid black line denotes the 1:1 identity relation, and the color scale represents the logarithm of the count number in each bin. Marginal (1D) histograms show the occurrence frequency of nT (top) and ne (right). The axis limits for both nT and ne have been selected to capture the bulk of the data while excluding extreme outliers.
Current usage metrics show cumulative count of Article Views (full-text article views including HTML views, PDF and ePub downloads, according to the available data) and Abstracts Views on Vision4Press platform.
Data correspond to usage on the plateform after 2015. The current usage metrics is available 48-96 hours after online publication and is updated daily on week days.
Initial download of the metrics may take a while.