Fig. 4.
Download original image
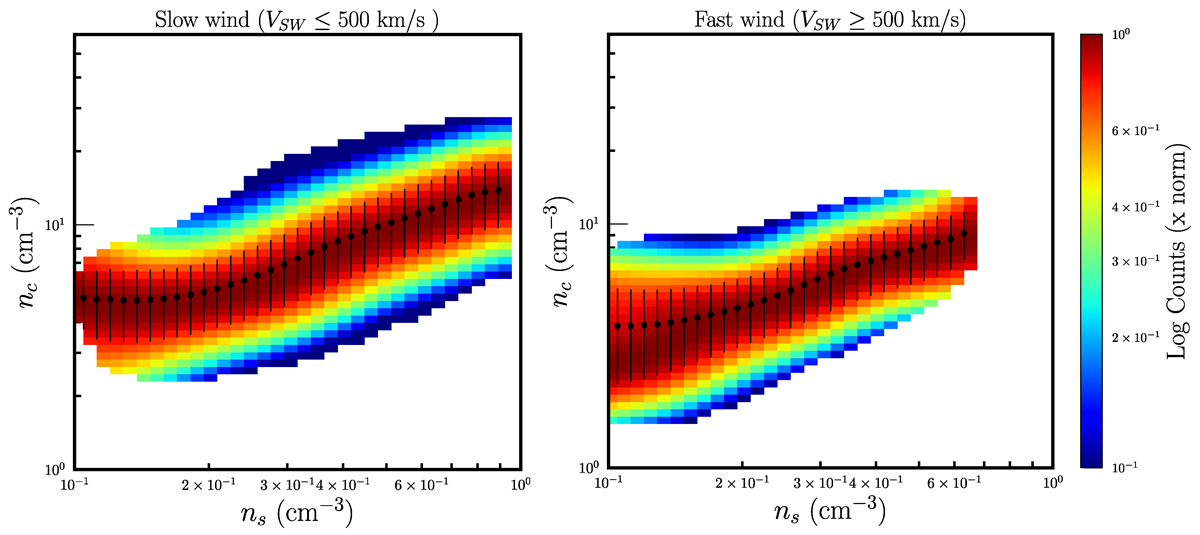
Normalized distribution of the core electron density, (nc cm3) and the strahlo electron density (ns cm3) for slow (left panel) and fast wind (right panel). The color bar represents the logarithm of the number of counts per bin, normalized to the maximum number of counts per bin in each column. The black circles mark the peak centroid in each column, and the black vertical lines represent the half-width or standard deviation based on a Gaussian fit to the normalized values in each column.
Current usage metrics show cumulative count of Article Views (full-text article views including HTML views, PDF and ePub downloads, according to the available data) and Abstracts Views on Vision4Press platform.
Data correspond to usage on the plateform after 2015. The current usage metrics is available 48-96 hours after online publication and is updated daily on week days.
Initial download of the metrics may take a while.