Open Access
Fig. 5.
Download original image
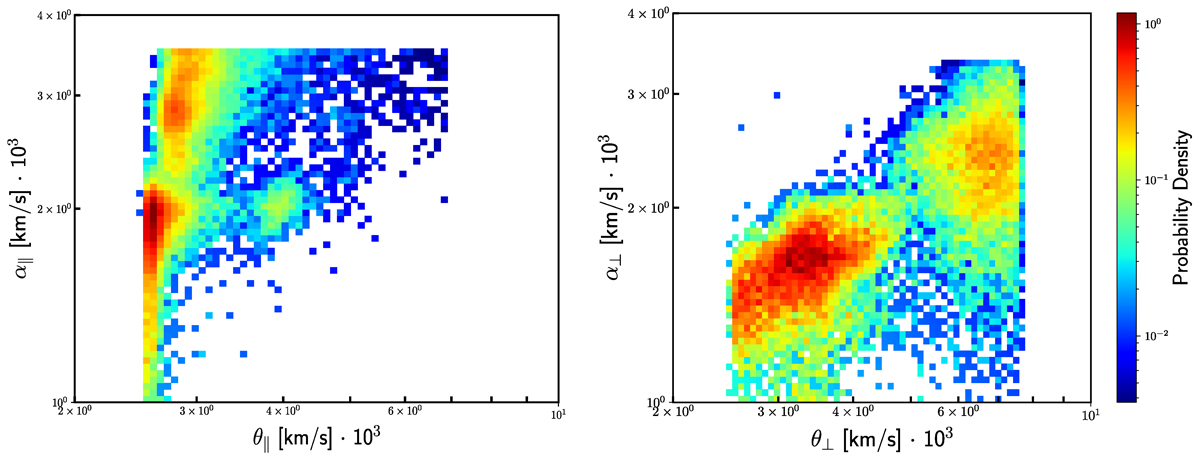
Probability density plots of the core thermal velocity (α) versus strahlo θ parameter. The left panel represents the velocities along the parallel direction, while the right panel corresponds to the perpendicular direction. Each point represents the 1-minute over the 50-day interval in 1995.
Current usage metrics show cumulative count of Article Views (full-text article views including HTML views, PDF and ePub downloads, according to the available data) and Abstracts Views on Vision4Press platform.
Data correspond to usage on the plateform after 2015. The current usage metrics is available 48-96 hours after online publication and is updated daily on week days.
Initial download of the metrics may take a while.