Fig. 8.
Download original image
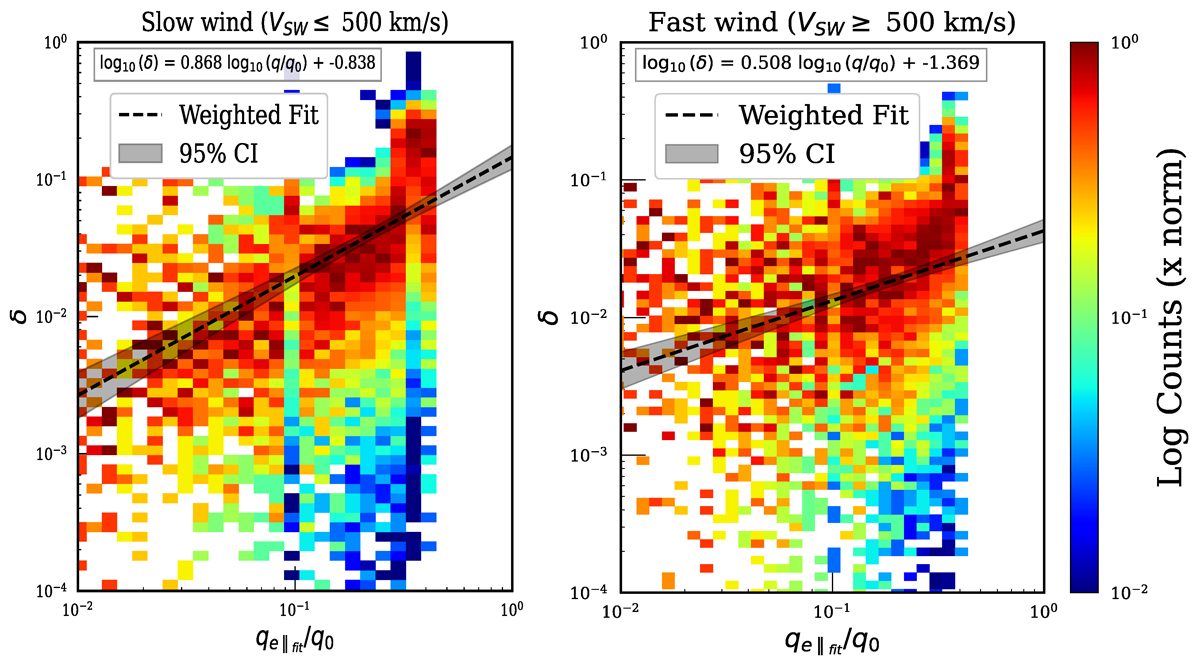
Column-normalized 2D histograms showing the relationship between the δ parameter and the parallel electron heat flux qe∥fit/q0) obtained from the CS fits, for slow solar wind (left panel) and fast solar wind (right panel). The color scale indicates the logarithm of the normalized bin counts. The dashed black line represents a weighted linear regression in log-log space, fitted using 2D histogram counts as statistical weights. The shaded region denotes the 95% confidence interval of the fit. The equation of the fitted relation is displayed in the top-left corner of each panel.
Current usage metrics show cumulative count of Article Views (full-text article views including HTML views, PDF and ePub downloads, according to the available data) and Abstracts Views on Vision4Press platform.
Data correspond to usage on the plateform after 2015. The current usage metrics is available 48-96 hours after online publication and is updated daily on week days.
Initial download of the metrics may take a while.