Fig. 2.
Download original image
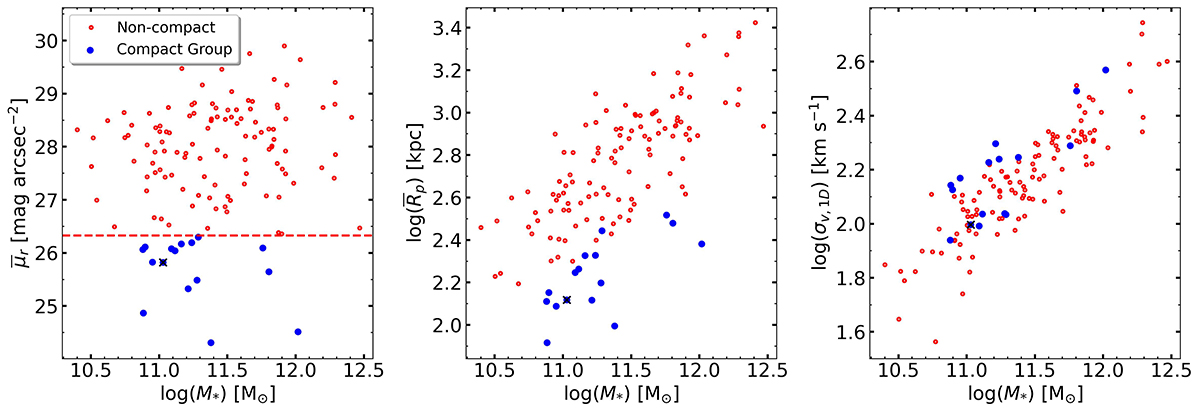
Redshift zero correlations of CG properties with total group stellar mass. From left to right: i) Mean surface brightness, ![]() ; ii) mean projected radius,
; ii) mean projected radius, ![]() ; and iii) 1D velocity dispersion, σv,1D, for all groups with four or more galaxies in TNG100. The threshold value,
; and iii) 1D velocity dispersion, σv,1D, for all groups with four or more galaxies in TNG100. The threshold value, ![]() (horizontal dashed red line, left panel), defines the sample of CGs (filled blue circles), while non-CGs (empty red circles) lie above this threshold. CGs are the smallest groups at a given stellar mass, but their velocity dispersions are similar to those of non-CGs. The values of the CG of Fig. 1 are shown with black crosses.
(horizontal dashed red line, left panel), defines the sample of CGs (filled blue circles), while non-CGs (empty red circles) lie above this threshold. CGs are the smallest groups at a given stellar mass, but their velocity dispersions are similar to those of non-CGs. The values of the CG of Fig. 1 are shown with black crosses.
Current usage metrics show cumulative count of Article Views (full-text article views including HTML views, PDF and ePub downloads, according to the available data) and Abstracts Views on Vision4Press platform.
Data correspond to usage on the plateform after 2015. The current usage metrics is available 48-96 hours after online publication and is updated daily on week days.
Initial download of the metrics may take a while.