| Issue |
A&A
Volume 702, October 2025
|
|
|---|---|---|
| Article Number | A22 | |
| Number of page(s) | 11 | |
| Section | Extragalactic astronomy | |
| DOI | https://doi.org/10.1051/0004-6361/202555375 | |
| Published online | 29 September 2025 | |
Compact groups of galaxies in the TNG100 simulation
1
Facultad de Matemática, Astronomía, Física y Computación, UNC, Medina Allende s/n, X5000HUA Córdoba, Argentina
2
Instituto de Astronomía Teórica y Experimental, CONICET–UNC, Laprida 854, X5000BGR Córdoba, Argentina
3
Observatorio Astronómico de Córdoba, UNC, Laprida 854, X5000BGR Córdoba, Argentina
4
Department of Physics and Astronomy, University of California, Riverside, CA 92521, USA
⋆ Corresponding author: This email address is being protected from spambots. You need JavaScript enabled to view it.
Received:
2
May
2025
Accepted:
15
August
2025
Abstract
Using the TNG100 cosmological simulation, we study the formation and evolution of compact groups of galaxies. Over a redshift range of 0 ≲ z ≲ 0.2, we identify these compact groups as Friends-of-Friends galaxy groups with a high mean surface brightness (μ¯r < 26.33 mag arcsec−2) and a minimum of four galaxy members. Typically, our compact groups have a median characteristic size of ∼150 kpc, 1D velocity dispersions of 150 km s−1, and stellar masses around 2 × 10¹¹ M⊙. Roughly 1% of galaxies that have a stellar mass above 109 M⊙ lie in physically dense compact groups. We found that these systems do not constitute a separate category within the broader population of galaxy groups; instead, they represent the lower end of the size distribution in the sequence of galaxy group sizes. We traced their evolution backward in time, revealing that they initially form as galaxy systems with a mean low surface brightness that systematically increases to a peak value before stabilizing over time, exhibiting oscillatory behaviour over the following several gigayears during which mergers may occur. Mergers often transform compact groups with typically four members into galaxy pairs or triplets, which eventually can again increase their number of members by accreting a new galaxy. Nevertheless, the full merging of all constituent galaxies into a single massive galaxy is a rare phenomenon.
Key words: galaxies: groups: general / galaxies: interactions / galaxies: kinematics and dynamics
© The Authors 2025
 Open Access article, published by EDP Sciences, under the terms of the Creative Commons Attribution License (https://creativecommons.org/licenses/by/4.0), which permits unrestricted use, distribution, and reproduction in any medium, provided the original work is properly cited.
This article is published in open access under the Subscribe to Open model. This email address is being protected from spambots. You need JavaScript enabled to view it. to support open access publication.
1. Introduction
Compact groups (CGs) are selected as isolated systems of a few galaxies (N ∼ 4) with a similar apparent magnitude (Δm < 3 mag) separated by distances of a few tens of kiloparsecs. They exhibit extremely high mean surface brightnesses (μ < 26 mag arcsec−2), comparable to the cores of rich galaxy clusters (see e.g., Hickson et al. 1992; McConnachie et al. 2009; Díaz-Giménez et al. 2012; Sohn et al. 2015). Their high densities, combined with relatively low velocity dispersions (σv ∼ 300 km s−1), result in estimated crossing times of only a few hundredths of the Hubble time (Mamon 1986; Díaz-Giménez et al. 2020; Zheng & Shen 2021). Consequently, the member galaxies are expected to merge within 1–2 Gyr (Carnevali et al. 1981; Mamon 1987; Governato et al. 1991; McConnachie et al. 2008), making CGs ideal laboratories for studying strong galaxy interactions and their impact on galactic evolution.
The existence of systems with such extreme apparent compactnesses is not well understood. Pioneer works theorised about the nature of CGs, arguing that they are physically dense configurations of galaxies (Hickson & Rood 1988), or transient configurations within looser (non-compact) groups (Rose 1979). However, CGs can also be produced by chance alignment of galaxies within non-CGs (Rose 1977; Mamon 1986; Walke & Mamon 1989; Mamon 2008) or even within filaments (Hernquist et al. 1995).
Studies of CG abundances at redshifts of 0 < z < 0.2, conducted in large surveys such as the Sloan Digital Sky Survey (SDSS, York et al. 2000) have demonstrated their presence at different cosmic times (see e.g., Sohn et al. 2015; Díaz-Giménez et al. 2018; Zheng & Shen 2021; Zheng et al. 2022). Several theories have been proposed to reconcile the observed abundances of CGs with their seemingly short lifetimes; for example, if mergers occur rapidly, new CGs must continually form to maintain the observed space density.
Regarding the evolution of physically dense CGs, Diaferio et al. (1994) suggested that a high accretion rate of new galaxies, comparable to the expected merger rate, could allow for the constant replenishment of galaxies within existing groups. Alternatively, CGs might form from looser (non-compact) galaxy groups through angular momentum loss due to dynamical friction (Schneider & Gunn 1982). Another possibility is that many identified CGs are fortuitous alignments of galaxies in configurations elongated along the line of sight, resulting in regions of of high surface brightness due to projection effects (Mamon 1986). Finally, if CGs do survive longer than expected, they should maintain their dense, compact configurations for several gigayears (Díaz-Giménez et al. 2021).
Large cosmological simulations enable the statistical analysis of CG properties and address issues of abundance and projection effects by providing 3D galaxy positions. Several authors analysed semi-analytical models of galaxy formation run on gravity-only simulations to create mock galaxy catalogues in which CGs can be identified, measuring the fraction of CGs that are physically compact and how many are identified as such only due to a fortuitous alignment of the members (see e.g., McConnachie et al. 2008; Díaz-Giménez & Mamon 2010). According to the distance between galaxies or the sphericity of groups (see McConnachie et al. 2008; Díaz-Giménez & Mamon 2010, respectively), 30–70% of CGs identified using observational criteria are physically compact. More recently, Díaz-Giménez et al. (2020) show that the contamination of CGs by chance alignments of galaxies is ∼50%, using newer semi-analytical models on cosmological simulations with more realistic initial cosmological parameters.
Compact groups, on the other hand, can also be identified using 3D search algorithms (see e.g. Taverna et al. 2016). Taverna et al. (2022) found that ∼90% of all CGs identified using Hickson criteria are substructures within large groups or clusters. These physically dense systems are found throughout cosmic time, and a significant fraction of galaxies have been part of such systems at a certain point of their evolution (Wiens et al. 2019).
Early studies of CG evolution used numerical methods to examine the survival of individual CGs under various idealised initial conditions and dark matter distributions (see e.g., Carnevali et al. 1981; Mamon 1987; Barnes 1989; Governato et al. 1991; Athanassoula et al. 1997). More recently, these systems have been analysed within realistic cosmological contexts using gravity-only simulations (see e.g., McConnachie et al. 2008; Farhang et al. 2017; Tzanavaris et al. 2019; Díaz-Giménez et al. 2021) and hydrodynamical simulations, which incorporate baryons within large volumes and offer a complementary approach to semi-analytical models applied to gravity-only simulations. For example, Hartsuiker & Ploeckinger (2020) used data from the Evolution and Assembly of GaLaxies and their Environments cosmological hydrodynamical simulation (EAGLE1, Schaye et al. 2015) to characterise CGs identified in a flux-limited mock catalogue. While the former approach isolates group evolution based on pre-defined parameters, the latter provides insights into evolution within more complex environments. Due to the diverse numerical methods employed and the highly non-linear nature of these systems, coalescence times (the timescale over which all members of a group sequentially merge into a single massive galaxy) vary widely, from as short as 0.5 Gyr to as long as 9 Gyr. Consequently, the temporal evolution of CGs is not yet fully understood.
The existence of these physically compact configurations of galaxies entails an open problem for the standard Λ Cold Dark Matter cosmology (ΛCDM). Questions arise as to how observed CG abundances at different redshifts can be explained, what role they play in hierarchical structure formation, whether they are a special kind of group of galaxies or a mere transient configuration of non-CGs, and how long CGs persist for. While state-of-the-art cosmological hydrodynamic simulations emerged as powerful tools for modelling galaxy formation and evolution in the past decade, their full potential remains to be explored in the context of CG studies. Hartsuiker & Ploeckinger (2020) found that the space density of simulated CGs remains almost constant at redshifts of 0 < z < 0.2, comparing it with that of CGs extracted from the Sloan Digital Sky Survey (SDSS) Data Release 6 by Sohn et al. (2015). The balance between CG formation and destruction can be explained considering that the majority of simulated CGs (∼60%) are transient configurations of groups of galaxies, only compact in projection, while those that are physically dense show typical coalescence times of2–3 Gyr. Aiming to further characterise the dynamical evolution of physically CGs, elucidating the mechanisms that cause a system to become or no longer be a CG, in this work we use the high-resolution cosmological hydrodynamic simulation from the IllustrisTNG suite, TNG100-1, to analyse the past and future evolution of CGs. This simulation has similar characteristics to the previously mentioned EAGLE simulation, but the scope of this work is to focus on the compaction time and occurrence of mergers or accretion of massive galaxies within CGs, defined as isolated groups of four or more similar-mass galaxies in physically compact configurations, and hence identify them in 3D space.
This paper is organised as follows. In Sect. 2 we present details of the simulation used and the CGs identification criteria. In Sect. 3 we define our samples, compute the abundances of these systems compared to other works, analyse the sample of CGs at redshift z = 0, and take a glance at its backward temporal evolution. In Sect. 4 we study the evolution of CGs formed before or at z = 0, their survival as CGs, their galaxy merger rates, and their possible full coalescence. We briefly discuss our results in Sect. 5, and finally in Sect. 6 we present our conclusions.
2. Methods
2.1. Simulation
We identified and followed the evolution of CGs in the Next Generation Illustris Simulations (IllustrisTNG2, Marinacci et al. 2018; Naiman et al. 2018; Pillepich et al. 2018; Springel et al. 2018; Nelson et al. 2019), a suite of magneto-hydrodynamic cosmological simulations of a standard ΛCDM Universe (h = 0.6774; Ωm = 0.3089; σ8 = 0.8159, consistent with Planck Collaboration XIII 2016). The initial conditions were set at redshift z = 127 and were obtained with the code N-GENIC (Springel et al. 2005). The simulations are evolved with the moving mesh code AREPO (Springel 2010; Pakmor et al. 2016) forward in time until z = 0. The properties of dark matter and baryon particles were systematically recorded in 100 snapshots at intervals of ∼0.15 Gyr. From this set of simulations, we used the data from TNG100-1, the highest-resolution run of the 110.73 Mpc3 box (hereafter TNG100). This simulation contains 18203 dark matter particles of mass mDM = 7.5 × 10⁶ M⊙, and an equal number of initial gas cells, with a ‘target baryon mass’ of mbaryon = 1.4 × 10⁶ M⊙, adopting the same force softening length for dark matter and star particles of ϵ = 0.74 kpc (at redshift z = 0). TNG100’s baryonic treatment (Weinberger et al. 2017; Pillepich et al. 2018) is an update to that of the Illustris project (Vogelsberger et al. 2013, 2014), assuming a Chabrier initial mass function (Chabrier 2003) and modelling stellar evolution as in Pillepich et al. (2018).
We used the halo and subhalo catalogues available for each snapshot, generated using a friends-of-friends with a particle linking length parameter of b = 0.2 (FoF, Davis et al. 1985) and the SUBFIND (Springel et al. 2001; Dolag et al. 2009) algorithms. We used the SubLink (Rodriguez-Gomez et al. 2015) merger tree to track the temporal evolution of identified galaxies. We considered galaxies with M* > 109 M⊙, ensuring well-resolved subhalos with more than ∼1000 stellar particles within twice the half-mass radius (using SubhaloMassInRadType[4] from SUBFIND). Position, velocity, stellar mass, SDSS r-band luminosity, and group membership were extracted from each snapshot’s galaxy catalogues. All sizes were converted from comoving to physical kiloparsecs.
2.2. Identification criteria
Although there is no unique definition of a CG, in observational works galaxy group compactness is typically quantified by mean surface brightness, μ (see e.g., McConnachie et al. 2009; Díaz-Giménez et al. 2012; Sohn et al. 2015), defined as follows:
 (1)
(1)
where mi is the apparent magnitude of the ith galaxy member of the CG and θ is the angular radii of the smallest circle enclosing all members. Using TNG100 data, we calculated the surface brightness in terms of luminosity, Li, and the projected radius, Rp, then converted from L⊙ kpc−2 to mag arcsec−2 using
 (2)
(2)
where ℳ⊙ = 4.65 is the absolute magnitude of the Sun in the SDSS r band (Willmer 2018) and the projected radius is the maximum projected distance from the centroid to a member of the group. Lower μ values indicate a higher surface brightness, and thus more CGs.
To physically investigate CGs of galaxies, we defined them as high-mean-surface-brightness groups, independent of projection, consisting of four or more galaxies with similar stellar masses. Our CG identification criteria are specifically designed to select for intrinsically compact configurations, allowing us to directly study the inherent properties and evolution of these systems. Our CG identification criteria are:
-
Isolation: The CG members perfectly match the galaxies of the single host group with stellar masses above one tenth of the central (M*, i > M*, central/10).
-
Richness: They contain at least four members (N ≥ 4).
-
Compactness: The geometric mean surface brightness of the CG, measured along the three Cartesian axes, must be above a threshold corresponding to
 ,
,
where M*, central is the central galaxy’s stellar mass, M*, i is the ith member’s stellar mass, N is the number of galaxies with stellar mass similar to the central in the FoF Group (including the central), and  is the mean surface brightness (Equation (2)) averaged over three orthogonal spatial projections:
  . This average provides a projection-independent compactness estimator, which is measured only accounting for the N galaxy members. The μ threshold value used to classify a group as compact varies between works and depends on the photometric band utilised. Since we used mock absolute magnitudes in the SDSS r band, we followed Taverna et al. (2016) and adopted
  as our CG identification threshold. The arithmetic mean of the three Cartesian surface brightnesses, expressed in surface magnitudes, provides a good measure of the physical density of CGs, since if a CG is a chance alignment of galaxies along the line of sight, it will usually appear as compact in only one of three Cartesian lines of sight and the mean surface brightness is likely to fail to meet the compactness threshold.
We note that our CGs always include the central galaxy of a FoF group (by definition) and thus cannot be substructures of larger groups. By analysing truly isolated groups, we avoid including a large number of CGs-within-groups, which Taverna et al. (2022) reported to be ∼90% of all redshift-space identified systems.
Figure 1 illustrates a simulated CG identified with this criteria and shows the projected spatial distribution of stellar particles of a CG in three orthogonal projections (XY, XZ, YZ) within 200 × 200 kpc2 regions, centred on the group’s geometric centre. This group consists of four galaxies with a stellar mass of M*, i > 1010 M⊙, conforming a physically compact system of  . The properties of this CG are highlighted in Table A.1. Members are ranked according to their stellar mass, and exhibit diverse morphologies. While 3 shows a disc morphology, 2 is a spheroid, and tidal features emerge between 1 and 4, highlighting the strong interactions within theseenvironments.
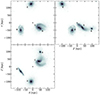 |
Fig. 1. Spatial distribution of stellar particles in three orthogonal projections (XY, XZ, YZ) for a redshift of z = 0 CG. This group (FoF group #469) consists of four galaxies with a similar stellar mass in a physically compact configuration ( |

3. Compact groups in TNG100
3.1. Compact groups at z = 0
Applying our criteria to the TNG100 halo and subhalo catalogues at redshift z = 0 (cosmic time tcosmic ≈ 13.8 Gyr), we identified 131 groups with four or more similar-mass galaxies. Among these groups, 15 (∼11%) satisfy  , constituting our z = 0 CG sample. This implies that ∼0.94% of all galaxies with M* > 109 M⊙ are members of CGs, which is in fair agreement with the fraction reported by Wiens et al. (2019).
In order to assess the projection effects on the identification of CGs, we compared the number of systems that satisfy the compactness criterion over random projections to the amount of true CGs that were found. Sixty to seventy percent of CGs identified in projection are truly compact with our criteria, a slightly higher fraction than that found by Díaz-Giménez et al. (2020).
In Fig. 2 we show properties of all groups3, compact or not, as function of the total stellar mass. The threshold value,  , separates CGs from non-CGs. With black crosses we indicate the values of the illustrative example shown in Fig. 1. These CGs have 4, 5, or 7 members4 (12, 2, and 1 CGs, respectively), and have sizes ranging between 80–320 kpc, systematically smaller than those non-compact at a fixed total stellar mass, as is expected (see Equation (2)). However, this does not hold for CGs with stellar mass-to-light ratios, M*/Lr < 1, in solar units, allowing those CGs with higher luminosities to have larger sizes. On the other hand, there is no segregation between CGs and non-CGs regarding their velocity dispersion. The broad range of velocity dispersions (σv,1D = 90–400 km s−1) is directly related to the total stellar mass of CGs, spanning over an order of magnitude (M* = 1010.8 − 12.2 M⊙).
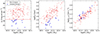 |
Fig. 2. Redshift zero correlations of CG properties with total group stellar mass. From left to right: i) Mean surface brightness, |


These velocity dispersions are roughly half of the virial velocity,  , where R200, c is the radius of the sphere of overdensity 200 times the critical density of the Universe, while M200, c is the mass within R200, c. The factor 0.5 is well below the factor of ∼0.68 predicted for number-follows-mass NFW models for groups (Eq. (B6) of Mamon et al. 2013), and also lower than the factor of ∼0.62 deduced from the analysis of velocity bias of galaxies in clusters by Anbajagane et al. (2022). We show σv,1D as function of v200, c for CGs and non-CGs in Fig. B.1. Since galaxy mergers are more frequent in low-mass groups compared to clusters (Mamon 1992; Krivitsky & Kontorovich 1997; Makino & Hut 1997), this suggests that the low velocity dispersions of low-mass groups, given their total mass, are caused by galaxy mergers that transform orbital energies into the internal energy of the remnant.
These results suggest that CGs are not statistically different systems of galaxies, but rather represent the high end of the surface brightness distribution of all groups, in agreement with recent observational works that compare CGs to non-CGs (Zheng et al. 2022; Tricottet et al. 2025). Hence, the  threshold is somewhat arbitrary, simply defining the CG sample size. The typical sizes and velocity dispersions of our CGs indicate that the crossing time of galaxies within these systems is 0.4–1.0 Gyr. Properties of all z = 0 CGs are listed in Table A.1.
3.2. Assembly of compact groups
Compact groups stand out as groups of 4 ≤ N ≤ 7 similar-mass galaxies in physically compact configurations, although their velocity dispersions are comparable to those of non-CGs. To investigate the pathways that lead to CG formation, we used each galaxy’s main progenitor to track the CG’s mean surface brightness evolution throughout cosmic time, covering 5.9 ≤ tcosmic/Gyr ≤ 13.8 (corresponding to a redshift range 0 ≤ z ≤ 1). Mean surface brightness,  , serves as a measure of group compactness, proportional to the galaxy luminosities and inversely proportional to the square of the group’s projected radius in three orthogonal directions, as is shown in Equation (2). Therefore, the evolution of a group’s surface brightness is driven by both stellar evolution and star formation within galaxies, which affects the total luminosity, and the group’s dynamical evolution, which alters member positions and thus the group’s size. In Fig. 3 we show the temporal evolution of these properties for each of the 15 CGs identified. We define as ‘threshold time’ (tthr) the earliest cosmic time when the group satisfies the compactness criterion, i.e. when its mean surface brightness,
  , drops below the threshold value 26.33 mag arcsec−2. The median tthr value (∼13.5 Gyr, blue arrow on the left panel) indicates that most CGs became compact less than 1 Gyr ago, with only two groups (∼13%) exhibiting tthr ≲ 10 Gyr and the older one showing tthr ≈ 7 Gyr. Among the diversity of curves, we note that CGs can become compact for the first time at early (∼7.0 Gyr) or late (≳13.0 Gyr) cosmic times.
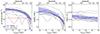 |
Fig. 3. Evolution of CG properties. From left to right: i) Group surface brightness, |


The centre and right panels of Fig. 3 show the temporal evolution of the group size and the total luminosity, respectively. In this range of cosmic time, the total luminosity of CGs changes only slightly (ΔL ∼ −0.2 dex), while group size decreases significantly (ΔRp ∼ −0.6 dex), from 650 ± 150 kpc at redshift z = 1 to 150 ± 50 kpc at z = 0. Although the decrease in luminosity lowers surface brightness, its median increases, mirroring the trend in group sizes. The median surface brightness change of ∼2.5 mag arcsec−2 is thus mainly caused by size rather than group luminosity variations. This implies that previous non-CGs can get smaller over time, achieving a sufficiently high surface brightness to be identified as CGs, after which orbital motion leads to oscillatory surface brightness evolution. On the other hand, the mild decrease in total luminosity may be attributed to passive stellar evolution (see e.g. Zandivarez et al. 2023).
4. Compact groups at z > 0
4.1. Abundance of compact groups
Initial works, starting with Hickson et al. (1992), studied samples of CGs covering redshifts z < 0.05. Then, subsequent studies obtained samples of CGs up to z ≲ 0.1 (Pompei & Iovino 2012, with DPOSS II data). More recent galaxy surveys, such as SDSS, allow for the identification of CGs within the range of 0 ≲ z ≲ 0.2 (Sohn et al. 2015; Zheng et al. 2022). Since this redshift range is somewhat small, the CG identification criteria used do not change with redshift. We maintain the same criteria described in Sect. 2.2 to identify CGs in 16 snapshots of TNG100, spanning redshifts 0 ≤ z ≤ 0.23 (cosmic time 11.0 ≲ tcosmic /Gyr ≤ 13.8) to compare their space density with observational (Sohn et al. 2015, SDSS DR12) and theoretical results (Hartsuiker & Ploeckinger 2020, mock galaxy catalogue from the EAGLE simulation), as is shown in Fig. 4. The TNG100 CG space density decreases by a factor of ∼3 from tcosmic ≈ 11.0 Gyr to 12.5 Gyr, remaining almost constantly ∼10−5 CGs Mpc−3 until z = 0. The decrease is larger than expected for a cosmological expansion-induced decrease (nCG ∝ a−3) with a constant number of CGs across different redshifts. We identify 23 CGs at z = 0.23, but only 16 at z = 0.1 and 15 at z = 0. Thus, the apparent flattening (within the Poisson errors, shaded red regions) exhibited at z < 0.1 could be caused by chance, where typically fewer systems are identified as CGs at cosmic times of 12 < tcosmic/Gyr < 13 and more CGs form at 13 < tcosmic/Gyr.
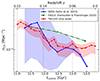 |
Fig. 4. Evolution of space density of CGs obtained in this work (TNG100, dashed red line with circles, shaded regions indicate Poisson errors), by Hartsuiker & Ploeckinger (2020, mock catalogue from EAGLE, dash-dotted green line with squares), and by Sohn et al. (2015, SDSS-DR12, solid blue line with circles). We use vertical dashed black lines to mark four TNG100 snapshots, separated by Δtcosmic ≈ 1 Gyr. Although at z ≈ 0 the abundances in TNG100 are a factor of ∼2 higher than the observed in SDSS, at higher redshifts the space density of CGs in TNG100 is consistent with that reported by observational works. |
Remarkably, despite comparing CGs identified observationally (SDSS) or in cosmological hydrodynamic simulations (EAGLE and TNG100), the abundances are consistent at redshift 0.1–0.2. We further discuss the discrepancies between works in Sect. 5.
Besides the CG sample obtained at z = 0 (hereafter CGsz = 0), we characterised CGs identified within redshifts of 0 < z ≤ 0.23. Based on the CGsz = 0 median threshold time, we avoided sample overlap, selecting CGs every 1 Gyr. Specifically, we analysed CGs identified at snapshots 94, 88, and 82, corresponding to redshifts of z = 0.06, 0.14, and 0.23, and lookback times of 0.81, 1.85, and 2.29 Gyr (shown as vertical lines in Fig. 4). Combined, these three samples comprise 52 CGs with the number of galaxy members, sizes, 1D velocity dispersions, mean surface brightnesses, and total stellar masses consistent with the CGz = 0 measured properties, i.e. these CGs are systems of 4–7 galaxies of a similar stellar mass, with  –500 kpc, σv,1D = 50–500 km s−1,
  –26.33 mag arcsec−2, and M* = 1010.7 − 12.2 M⊙. The samples comprise 14 CGs identified at redshift z = 0.06, 15 CGs at z = 0.14 and 23 CGs at z = 0.23. All of these systems constitute the ∼10% groups with highest compactness at their redshift, except for the sample of z = 0.23, which represents the ∼15% tail of the compactness distribution.
4.2. Evolution of compact groups
We extend the analysis of the assembly of CGs to study the temporal evolution of CGs identified at z > 0. In Fig. 5 we show the median compactness evolution and threshold times for the three samples selected. At early times (6 ≲ tcosmic/Gyr ≲ 8), most systems exhibit low surface brightness. After a visual inspection of the members’ trajectories, we found that galaxies at these epochs were in looser configurations or not even in the same group. This relatively late assembly, combined with typical threshold times indicating that most of these groups become compact only about ∼1 Gyr before identification (consistent with the results for CGsz = 0, Sect. 3.2), shows that CGs originate from the sequential infall of galaxies into the same halo, where they gradually get closer until they reach a maximum compactness configuration. This reinforces the arbitrariness of the threshold value of  , as the maximum surface brightness of each CG depends on the impact parameter of the infalling galaxies.
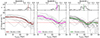 |
Fig. 5. Evolution of CG mean surface brightness, split by CG identification redshift. Histograms of threshold times are shown in the top panels. From left to right, we show CGs identified at redshift z = 0.06, z = 0.14, and z = 0.23. The median of each is shown as a solid coloured line (dark red, magenta, and green, respectively). The vertical dotted black line indicates the identification time of each sample. CGs at different epochs evolve similarly: most cross the surface brightness threshold less than 1 Gyr before identification, reach maximum compactness shortly after, and then galaxies begin to orbit within the group. Post-identification evolution is highly diverse, reflecting the chaotic nature of these systems. |
Since the identification occurs at redshifts z > 0, we now study how already assembled CGs evolve until z = 0. There is no unique pathway for the evolution of CGs, where some groups become looser systems again, and a few reach extremely high surface brightness values. While the former cases correspond to transient CGs, galaxies that are in high-compactness configurations for only a brief period of time, the latter cases correspond to systems that end with fewer than four galaxies, whereby mergers within members occur after the first close encounter, and they begin to orbit each other. In total, the median of each sample suggests that the majority of CGs meet the compactness criterion for about ∼2 Gyr.
Since the cosmic time of identification only affects sample selection, in Fig. 6 we show the median curves for all analysed samples in this work (z = 0.00, 0.06, 0.14, and 0.23), shifted by their median threshold time, i.e. when 50% of groups from a sample become compact. There is a clear similarity between the median of different samples, with most groups showing surface brightnesses as low as  at tcosmic − tthr ≲ −3 Gyr. This corresponds to CGs not having all their members inhabiting the same halo until 1–2 Gyr before compaction, as was previously mentioned. At those times, the scatter is almost constantly
  , until groups reach a maximum compactness of 25.5–26.0 mag arcsec−2. Typically, this is achieved at tcosmic − tthr ≈ 1.5 Gyr, which is arbitrary due to the fixed threshold value, and thus it affects the time elapsed from identification to maximum group surface brightness. CGsz = 0 (solid blue line) will follow the same trend, but they have not evolved enough to reach maximum compactnesses. All medians stop at tcosmic ≈ 13.8 Gyr, since it is the last snapshot of the simulation.
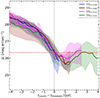 |
Fig. 6. Evolution of CG mean surface brightness in time relative to median threshold crossing. Shaded regions encompass the 25th-75th percentiles. Colours indicate samples identified at redshift z = 0.00 (blue), z = 0.06 (dark red), z = 0.14 (magenta), and z = 0.23 (green). The last point of each curve corresponds to the final snapshot, at tcosmic ≈ 13.8 Gyr. The horizontal dashed red line shows the threshold |

After the maximum surface brightness is achieved, the scatter within samples increases significantly ( ) due to the diversity of evolutionary pathways of these extremely compact systems. CGs identified at tcosmic ≲ 12 Gyr (CGsz = 0.14 and CGsz = 0.23) have enough time to evolve and spuriously satisfy multiple times the compactness criterion through time due to orbital motions of galaxies within groups.
In Sect. 3.1 we demonstrate that CGs are not a distinct population of galaxy groups, but rather the smallest groups at a given total stellar mass. Their surface brightness evolution reveals them to be transient configurations of galaxies. Median curves indicate that most are undergoing their first pericenter passage, resulting in a temporary peak in surface brightness shortly after compaction. This is supported by the fact that most CGs were in looser configurations 1–2 Gyr prior to identification, with only a few having early threshold times and experiencing a second phase of high surface brightness. Most groups of four or more similar-mass galaxies are recently assembled and cannot maintain a compact configuration for several gigayears due to orbital motion and/or mergers between members.
4.3. Survival of compact groups by z = 0
While Fig. 5 indicates that most CGsz > 0 end up in as configurations of galaxies sufficiently dense to fulfil the compactness criterion, fewer CGs are finally identified at z = 0. Furthermore, the threshold times also indicate that CGs form statistically shortly before identification. To understand this deficit of long-lived CGs, we must consider not only surface brightness evolution but also member interactions and accretion of galaxies into these isolated systems. Using the identification criteria from Sect. 2.2 (richness, compactness, and isolation), we consider both the occurrence of mergers between members and the number of galaxies with similar stellar mass that inhabits the same halo as the CG after identification, to elucidate what causes a group of galaxies to stop being a CG. For instance, if the central of a CG is no longer the central of the host halo after a few gigayears, the system can no longer be considered as isolated (e.g. due to the infall into a cluster).
We studied the occurrence of mergers and group isolation by redshift z = 0, tracing the SUBLINK’s main descendants of each galaxy of CGsz > 0. We then determined how many CGs remain as isolated groups of four or more similar-mass galaxies in a compact configuration (i.e. fully satisfying all criteria for the inclusion in the CGsz = 0 sample), measuring the fraction of groups that satisfy each criterion to identify the primary driver of the CGs abundances measured in TNG100. In Fig. 7 we show the percentage of each sample (colour-coded by identification time, as in Fig. 5) that satisfies each criterion at z = 0 and all three simultaneously. Each sample was analysed separately due to differing evolution times. For example, some CGsz = 0.23 had enough time (Δt ≈ 3 Gyr) to experience a second high-compactness phase5 and thus exhibit higher fraction of groups that satisfy the compactness criterion than CGsz = 0.14.
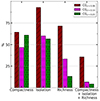 |
Fig. 7. Percentages of CGs meeting a given CG selection criterion at z = 0, split by CG identification epoch. The sample of z = 0.06 is shown in dark red, the one of z = 0.14 in magenta, and that of z = 0.23 in green. The criteria analysed are compactness, isolation, richness, and all three simultaneously. While 68% of CGsz > 0 remain isolated by z = 0, only 33% are still conformed by at least four similar-mass galaxies. A small fraction of CGs remain as such at z = 0, with lower values shown by older samples. |
Considering the two oldest samples (CGsz = 0.14 in hatched magenta bars, and CGsz = 0.23 in dotted green bars), their least fulfilled criterion is the richness one, suggesting that this is the main driver of the low percentage of long-lived CGs remaining by z = 0. Only 1/23 (4%) of CGsz = 0.23 and 1/15 (7%) of CGsz = 0.14 persist as CGs. Thus, most systems do not remain as CGs long after identification due to mergers between members. However, although the majority6 of CGs identified at z > 0.1 fail the richness criterion at z = 0, strikingly only one becomes a single, isolated massive galaxy (we present more details in Sect. 4.4). Finally, 68% of CGsz > 0 remain isolated by z = 0, i.e. only 32% fail the isolation criterion, experiencing the accretion of at least one galaxy with similar or greater stellar mass than the CG’s central that ends up inhabiting the same halo. No CG undergoes a ‘split’ or ‘fragmentation’, whereby members end in different host haloes, as has been found in observed CGs (cf. Zheng & Shen 2021; Tricottet et al. 2025).
In a ΛCDM Universe, in which structure formation proceeds hierarchically, accretion of massive galaxies into groups is expected within a Hubble time (see e.g. Genel et al. 2010; Rodriguez-Gomez et al. 2015). Our results suggest that, after group assembly and compaction, mergers between members occur more rapidly than the accretion of galaxies with a mass similar to or greater than that of the central one. This is supported by the higher fraction of CGs failing the richness criterion rather than the isolation criterion by z = 0. Nevertheless, mergers remain relatively infrequent, with most systems persisting as triplets after the first merger. This may be attributed to the relatively high velocity dispersions at high masses (see e.g. Krivitsky & Kontorovich 1997; Makino & Hut 1997). The frequency of mergers between members within an already assembled CG is thus not trivial and is thoroughly explored in the next subsection.
4.4. Merger rate and coalescence of compact groups
The expected short crossing times of CGs indicate that their galaxies should merge altogether in a few gigayears. However, in TNG100 we found only 1 CG (identified at z = 0.23) whose galaxies all merge, resulting in a single galaxy of stellar mass M* ≈ 1011 M⊙ without any satellites of M* > 109 M⊙, which is thus extremely isolated in its host halo. In Fig. 8 we show this CG at the identification time of tcosmic ≈ 11.0 Gyr (z = 0.23, top panel) and its remnant at tcosmic ≈ 13.8 Gyr (z = 0, bottom panel). The cyan circles highlight the four members of the CG that merge into a single, massive, isolated galaxy at z = 0. After a visual inspection of the trajectories of these four galaxy members, we found that these are two pairs of galaxies that begin to inhabit the same halo and approach each other head-on until they get close enough to be identified as a CG. Shortly after, each pair merges, resulting in two massive galaxies. Finally, these two galaxies end up merging together and the final galaxy remains in the halo without any non-dwarf satellite. The main characteristics and assembly history of this galaxy resemble that attributed to fossil groups (Ponman et al. 1994; Jones et al. 2003), which harbour hot gas with the extent and other properties expected for groups, but the optical light is completely dominated by a single luminous, giant elliptical galaxy (for a comprehensive review on the relation between fossil groups and CGs see Farhang et al. 2017; Aguerri & Zarattini 2021).
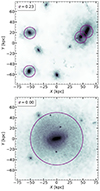 |
Fig. 8. Two snapshots of the coalescing CG: when identified (top) and at present (bottom). This is the only group studied for which all members merge into a single galaxy before z = 0. The purple circles indicate the four members of the CG, while other dark regions indicate dwarf galaxies that do not have a stellar mass similar to the members of the CG. This CGz = 0.23 is the result of a close encounter between two pairs of galaxies: the two at the left (X ≈ −50 kpc), and the two at the right (X ≈ 60 kpc), which are very close in projection and show some signs of tidal interaction. Darker colours indicate a higher number density of particles. Images were generated with the Py-SPH Viewer library (Benítez-Llambay 2017). |
Analysing each of the 52 CGs identified at redshift z > 0, one ends up as a single galaxy (shown in Fig. 8), none as a pair of galaxies, and the other 51 remain as systems of three or more galaxies by z = 0; the majority remain isolated and a few have become substructures of larger systems. Since the only CG to coalesce belongs to the CGz = 0.23 sample, we further studied the complete population of galaxy groups from z = 0.23 (including both compacts and non-compacts), measuring the frequency of mergers throughout their evolution. Although there are some groups that experience more than one merger, the CG shown in Fig. 8 is the only one7 whose members coalesced.
Taking into account all mergers between galaxy members from CGsz > 0, we found a rate of (0.24 ± 0.32) mergers per gigayear in these systems8. As is shown in Fig. 9 (colour-coded by sample, as in Fig. 7), the CGsz = 0.23 sample is the only one in which the majority of groups has experienced at least one merger (14/23, 61%). For those CGsz > 0 that experienced at least one merger (23/52, 44%), the first one occurs (0.92 ± 0.46) Gyr after identification and it is the only one in ∼91% of cases. The apparent extreme rarity of CGs (and groups in general) that accomplish coalescence suggests that the time needed to merge four or more massive galaxies in a cosmological environment is Δt ≳ 3 Gyr (cosmic time between z = 0.23 and z = 0). Further studies of the initial conditions and properties of these particular cases of groups that fully coalesce are needed and are out of the scope of this paper.
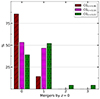 |
Fig. 9. Distribution of number of galaxy mergers within CGs, split by identification epoch. While only 2/15 (∼14%) of CGsz = 0.06 experience one merger, the CGsz = 0.23 sample is the only in which most systems have experienced at least one merger. Coalescence of CGs that had Δt < 3 Gyr to evolve is somewhat infrequent. |
5. Discussion
The criteria described in Sect. 2.2 allow us to study physically compact systems constituted by four or more galaxies with a similar stellar mass, including the central galaxy of the host halo. These criteria avoid contamination from spurious groups that can appear compact in projection, and configurations of galaxies that are substructures within larger systems and thus not isolated. We limit the definition of ‘similar mass’ to one order-of-magnitude difference (1 dex) in stellar mass rather than the commonly used three magnitudes (1.2 dex in luminosity), aiming for the analysis of the survival of systems with members with masses within an order of magnitude. Furthermore, tidal interactions induce star formation and thus enhance galaxy luminosities, which relies on the photometric band choice and the assumed stellar population synthesis models of the simulation.
Given these caveats, the properties of our CG samples are fairly comparable with both theoretical and observational work. First, CGs are not a special sub-type of groups, since compared to all isolated and rich groups, they are only the ∼10% tail of the distribution of group compactness, being the smallest at given stellar mass. There is no segregation on both the compactness and velocity dispersion between CGs and non-CGs, in agreement with the observational results shown by, for example, Zheng et al. (2022) and Tricottet et al. (2025).
The 3D compactness criterion ensures galaxies in physically compact configurations when averaged over three orthogonal projections, using as the projected size the maximum distance of a member to the geometric centre of the system. This radius is a factor of 1–1.4 larger than the smallest circumscribed circle, which is commonly used to define the size of a system. However, the main properties of the CGs identified are robust to different definitions of group size.
Limiting the search to a single axis and measuring the fraction of truly CGs within all the identified CGs, we found that 60–70% of CGs in projection are truly compact. This fraction is larger than the one found by Díaz-Giménez et al. (2020) using semi-analytical models on gravity-only simulations and by Hartsuiker & Ploeckinger (2020) using the EAGLE cosmological hydrodynamical simulation. The key differences may reside on the richness and similarity criteria used in these works, in which systems with fewer galaxies (N ≥ 3) and a brightness difference of Δm ≤ 3 mag are allowed. In addition, the previously mentioned authors performed their analysis in redshift space, which is more prone to projection effects in comparison with searches in real space, as we used in this work.
Lastly, we studied the temporal evolution within 1 ≥ z ≥ 0 of the simulated CGs. Most systems start to meet the selection criteria about 1 Gyr before identification, and only a few are going through a second phase of CGs. Regarding formation channels, Díaz-Giménez et al. (2021) analysed light cones derived from semi-analytical models previously run on gravity-only simulations and found that fewer than 10% of true CGs formed at early times and remained as such over several gigayears. After a visual inspection of the trajectories of the members, we found that the main mechanisms of CG formation are: i) when a fourth galaxy enters the same host halo of an already formed triplet of galaxies; and ii) when two pairs of galaxies are having a close encounter, satisfying the compactness criterion at the identification time.
Following these systems forwards in time, we found that most are CGs only for about 1–3 Gyr in total. Shortly after group assembly, members can merge or infall into other massive structures. Only one group remained rich (N ≥ 4), isolated, and compact after 3 Gyr of cosmic evolution, and also only one fully accomplished coalescence (whereby all members merge altogether). This suggests that i) the survivability of CGs is lower than was predicted by Díaz-Giménez et al. (2021); and ii) the coalescence time of CGs is longer than the results shown by Hartsuiker & Ploeckinger (2020). These inconsistencies with other theoretical works may be attributed to i) using a similar mass rather than a similar luminosity, since luminosity could be a bad tracer of mass when bursts of star formation are triggered by tidal interactions, and galaxies with a similar mass are more affected by dynamical friction within the same host halo, and thus a higher frequency of mergers is expected; and ii) the richness criterion, because mergers can happen more frequently, but our systems consist of at least four massive galaxies that may need more time to fully coalesce compared to the CGs of three galaxies that dominate the sample of Hartsuiker & Ploeckinger (2020) in the EAGLE simulation.
6. Summary and conclusions
In this work, we have used the TNG100 hydrodynamic cosmological simulation to characterise the evolution of CGs of galaxies identified at low redshifts (0 ≤ z ≤ 0.23). We defined CGs as systems with four or more similar-mass galaxies inhabiting the same halo and exhibiting a high group surface brightness in three orthogonal projections. Our derived abundance of these systems is consistent with the space density of CGs identified in SDSS-DR12 (Sohn et al. 2015).
We analysed the surface brightness evolution of four CG samples across cosmic times of 5.9 ≲ tcosmic/Gyr ≲ 13.8, measuring their typical compaction timescale. We found that most CGs achieve high compactness less than 1 Gyr before identification, while others assembled several gigayears ago and are experiencing a second phase of compaction. Statistically, all CGs follow a similar evolutionary path: galaxies begin to inhabit the same halo (group assembly), reach a maximum group surface brightness (associated with a first close encounter), and then begin orbiting one another.
Tracking the forward temporal evolution of CGs identified at z > 0, we found that 89% fail at least one identification criterion before z = 0. Mergers are the primary driver of this disruption, particularly in groups evolving for more than 2 Gyr. This indicates a higher merger rate between group members than the accretion rate of new massive galaxies into the group halo. Notably, we observed only one group that achieved complete coalescence, where all galaxies progressively merged into a single, massive, and extremely isolated galaxy.
Our analysis suggest that CGs are transient configurations of groups of galaxies, unable to remain as isolated systems of four or more similar-mass galaxies in a physically compact configuration, and thus satisfying the identification criteria only for short periods. However, the high frequency of mergers compared to the accretion of new massive galaxies makes CGs excellent laboratories for studying the effects of galaxy tidal interactions within a ΛCDM Universe. Given the brief duration of the CG phase, their abundance throughout cosmic evolution can be explained by the close encounters of several similar-mass galaxies, representing one more step in the hierarchical formation of cosmic structures.
We only account for galaxies with a stellar mass above one tenth of the central of a group to measure these properties.
There are not CGs of 6 galaxies in this sample.
This can also be inferred from the median surface brightness evolution in Fig. 5.
67% of CGsz = 0.14 and 87% of CGsz = 0.23.
Labelled as FoF group #345 at redshift z = 0.23 and FoF group #341 at redshift z = 0.
These values are the average and standard deviation.
Acknowledgments
We thank the referee Gary Mamon for an excellent and a very constructive report of the manuscript. The authors are also thankful to Julio Navarro for helpful discussions that helped shape this paper. This work was partially supported by the Consejo de Investigaciones Científicas y Técnicas de la República Argentina (CONICET) and the Secretaría de Ciencia y Técnica de la Universidad Nacional de Córdoba (SeCyT). The IllustrisTNG simulations were undertaken with compute time awarded by the Gauss Centre for Supercomputing (GCS) under GCS Large-Scale Projects GCS-ILLU and GCS-DWAR on the GCS share of the supercomputer Hazel Hen at the High Performance Computing Center Stuttgart (HLRS), as well as on the machines of the Max Planck Computing and Data Facility (MPCDF) in Garching, Germany. JAB is grateful for partial financial support from NSF-CAREER-1945310 and NSF-AST-2107993 grants.
References
- Aguerri, J. A. L., & Zarattini, S. 2021, Universe, 7, 132 [NASA ADS] [CrossRef] [Google Scholar]
- Anbajagane, D., Aung, H., Evrard, A. E., et al. 2022, MNRAS, 510, 2980 [CrossRef] [Google Scholar]
- Athanassoula, E., Makino, J., & Bosma, A. 1997, MNRAS, 286, 825 [NASA ADS] [Google Scholar]
- Barnes, J. E. 1989, Nature, 338, 123 [NASA ADS] [CrossRef] [Google Scholar]
- Benítez-Llambay, A. 2017, Py-SPHViewer: Cosmological simulations using Smoothed Particle Hydrodynamics, Astrophysics Source Code Library [record ascl:1712.003] [Google Scholar]
- Carnevali, P., Cavaliere, A., & Santangelo, P. 1981, ApJ, 249, 449 [Google Scholar]
- Chabrier, G. 2003, PASP, 115, 763 [Google Scholar]
- Davis, M., Efstathiou, G., Frenk, C. S., & White, S. D. M. 1985, ApJ, 292, 371 [Google Scholar]
- Diaferio, A., Geller, M. J., & Ramella, M. 1994, AJ, 107, 868 [NASA ADS] [CrossRef] [Google Scholar]
- Díaz-Giménez, E., & Mamon, G. A. 2010, MNRAS, 409, 1227 [CrossRef] [Google Scholar]
- Díaz-Giménez, E., Mamon, G. A., Pacheco, M., Mendes de Oliveira, C., & Alonso, M. V. 2012, MNRAS, 426, 296 [Google Scholar]
- Díaz-Giménez, E., Zandivarez, A., & Taverna, A. 2018, A&A, 618, A157 [NASA ADS] [CrossRef] [EDP Sciences] [Google Scholar]
- Díaz-Giménez, E., Taverna, A., Zandivarez, A., & Mamon, G. A. 2020, MNRAS, 492, 2588 [Google Scholar]
- Díaz-Giménez, E., Zandivarez, A., & Mamon, G. A. 2021, MNRAS, 503, 394 [Google Scholar]
- Dolag, K., Borgani, S., Murante, G., & Springel, V. 2009, MNRAS, 399, 497 [Google Scholar]
- Farhang, A., Khosroshahi, H. G., Mamon, G. A., Dariush, A. A., & Raouf, M. 2017, ApJ, 840, 58 [Google Scholar]
- Genel, S., Bouché, N., Naab, T., Sternberg, A., & Genzel, R. 2010, ApJ, 719, 229 [NASA ADS] [CrossRef] [Google Scholar]
- Governato, F., Bhatia, R., & Chincarini, G. 1991, ApJ, 371, L15 [Google Scholar]
- Hartsuiker, L., & Ploeckinger, S. 2020, MNRAS, 491, L66 [Google Scholar]
- Hernquist, L., Katz, N., & Weinberg, D. H. 1995, ApJ, 442, 57 [Google Scholar]
- Hickson, P., & Rood, H. J. 1988, ApJ, 331, L69 [Google Scholar]
- Hickson, P., Mendes de Oliveira, C., Huchra, J. P., & Palumbo, G. G. 1992, ApJ, 399, 353 [Google Scholar]
- Jones, L. R., Ponman, T. J., Horton, A., et al. 2003, MNRAS, 343, 627 [NASA ADS] [CrossRef] [Google Scholar]
- Krivitsky, D. S., & Kontorovich, V. M. 1997, A&A, 327, 921 [Google Scholar]
- Makino, J., & Hut, P. 1997, ApJ, 481, 83 [NASA ADS] [CrossRef] [Google Scholar]
- Mamon, G. A. 1986, ApJ, 307, 426 [Google Scholar]
- Mamon, G. A. 1987, ApJ, 321, 622 [NASA ADS] [CrossRef] [Google Scholar]
- Mamon, G. A. 1992, ApJ, 401, L3 [NASA ADS] [CrossRef] [Google Scholar]
- Mamon, G. A. 2008, A&A, 486, 113 [NASA ADS] [CrossRef] [EDP Sciences] [Google Scholar]
- Mamon, G. A., Biviano, A., & Boué, G. 2013, MNRAS, 429, 3079 [Google Scholar]
- Marinacci, F., Vogelsberger, M., Pakmor, R., et al. 2018, MNRAS, 480, 5113 [NASA ADS] [Google Scholar]
- McConnachie, A. W., Ellison, S. L., & Patton, D. R. 2008, MNRAS, 387, 1281 [Google Scholar]
- McConnachie, A. W., Patton, D. R., Ellison, S. L., & Simard, L. 2009, MNRAS, 395, 255 [NASA ADS] [CrossRef] [Google Scholar]
- Naiman, J. P., Pillepich, A., Springel, V., et al. 2018, MNRAS, 477, 1206 [Google Scholar]
- Nelson, D., Springel, V., Pillepich, A., et al. 2019, Comput. Astrophys. Cosmol., 6, 2 [Google Scholar]
- Pakmor, R., Springel, V., Bauer, A., et al. 2016, MNRAS, 455, 1134 [Google Scholar]
- Pillepich, A., Nelson, D., Hernquist, L., et al. 2018, MNRAS, 475, 648 [Google Scholar]
- Planck Collaboration XIII. 2016, A&A, 594, A13 [NASA ADS] [CrossRef] [EDP Sciences] [Google Scholar]
- Pompei, E., & Iovino, A. 2012, A&A, 539, A106 [NASA ADS] [CrossRef] [EDP Sciences] [Google Scholar]
- Ponman, T. J., Allan, D. J., Jones, L. R., et al. 1994, Nature, 369, 462 [Google Scholar]
- Rodriguez-Gomez, V., Genel, S., Vogelsberger, M., et al. 2015, MNRAS, 449, 49 [Google Scholar]
- Rose, J. A. 1977, ApJ, 211, 311 [NASA ADS] [CrossRef] [Google Scholar]
- Rose, J. A. 1979, ApJ, 231, 10 [Google Scholar]
- Schaye, J., Crain, R. A., Bower, R. G., et al. 2015, MNRAS, 446, 521 [Google Scholar]
- Schneider, D. P., & Gunn, J. E. 1982, ApJ, 263, 14 [NASA ADS] [CrossRef] [Google Scholar]
- Sohn, J., Hwang, H. S., Geller, M. J., et al. 2015, J. Korean Astron. Soc., 48, 381 [NASA ADS] [CrossRef] [Google Scholar]
- Springel, V. 2010, MNRAS, 401, 791 [Google Scholar]
- Springel, V., White, S. D. M., Tormen, G., & Kauffmann, G. 2001, MNRAS, 328, 726 [Google Scholar]
- Springel, V., White, S. D. M., Jenkins, A., et al. 2005, Nature, 435, 629 [Google Scholar]
- Springel, V., Pakmor, R., Pillepich, A., et al. 2018, MNRAS, 475, 676 [Google Scholar]
- Taverna, A., Díaz-Giménez, E., Zandivarez, A., Joray, F., & Kanagusuku, M. J. 2016, MNRAS, 461, 1539 [NASA ADS] [CrossRef] [Google Scholar]
- Taverna, A., Díaz-Giménez, E., Zandivarez, A., & Mamon, G. A. 2022, MNRAS, 511, 4741 [CrossRef] [Google Scholar]
- Tricottet, M., Mamon, G. A., & Díaz-Giménez, E. 2025, A&A, 699, A329 [NASA ADS] [CrossRef] [EDP Sciences] [Google Scholar]
- Tzanavaris, P., Gallagher, S. C., Ali, S., et al. 2019, ApJ, 871, 242 [Google Scholar]
- Vogelsberger, M., Genel, S., Sijacki, D., et al. 2013, MNRAS, 436, 3031 [Google Scholar]
- Vogelsberger, M., Genel, S., Springel, V., et al. 2014, Nature, 509, 177 [Google Scholar]
- Walke, D. G., & Mamon, G. A. 1989, A&A, 225, 291 [NASA ADS] [Google Scholar]
- Weinberger, R., Springel, V., Hernquist, L., et al. 2017, MNRAS, 465, 3291 [Google Scholar]
- Wiens, C. D., Wenger, T. V., Tzanavaris, P., et al. 2019, ApJ, 873, 124 [Google Scholar]
- Willmer, C. N. A. 2018, ApJS, 236, 47 [Google Scholar]
- York, D. G., Adelman, J., Anderson, J. E., Jr, et al. 2000, AJ, 120, 1579 [Google Scholar]
- Zandivarez, A., Díaz-Giménez, E., Taverna, A., & Mamon, G. A. 2023, MNRAS, 526, 3697 [NASA ADS] [CrossRef] [Google Scholar]
- Zheng, Y.-L., & Shen, S.-Y. 2021, ApJ, 911, 105 [CrossRef] [Google Scholar]
- Zheng, Y.-L., Shen, S.-Y., & Feng, S. 2022, ApJ, 926, 119 [NASA ADS] [CrossRef] [Google Scholar]
Appendix A: Properties of compact groups of TNG100 identified at z = 0
Main properties of the 15 CGs identified at redshift z = 0 in TNG100.
Appendix B: Velocity dispersion of rich groups of TNG100
As mentioned in Sec. 3.1, we measure the velocity dispersion of rich (N ≥ 4) groups (compact or not) and compare it with their virial velocity, as shown in Fig. B.1. These low-mass groups from TNG100 exhibit a σv, 1D/v200, c ≈ 0.5 (solid line), lower than previously theoretical predictions (dashed lines).
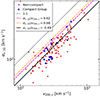 |
Fig. B.1. Velocity dispersion as function of virial velocity for rich (N ≥ 4) groups of TNG100. We use the same 131 rich groups of Fig. 2. Lines show different σv, 1D/v200, c ratios, as indicated by the labels. |
All Tables
All Figures
|
Fig. 1. Spatial distribution of stellar particles in three orthogonal projections (XY, XZ, YZ) for a redshift of z = 0 CG. This group (FoF group #469) consists of four galaxies with a similar stellar mass in a physically compact configuration ( |
| In the text | |
|
Fig. 2. Redshift zero correlations of CG properties with total group stellar mass. From left to right: i) Mean surface brightness, |
| In the text | |
|
Fig. 3. Evolution of CG properties. From left to right: i) Group surface brightness, |
| In the text | |
|
Fig. 4. Evolution of space density of CGs obtained in this work (TNG100, dashed red line with circles, shaded regions indicate Poisson errors), by Hartsuiker & Ploeckinger (2020, mock catalogue from EAGLE, dash-dotted green line with squares), and by Sohn et al. (2015, SDSS-DR12, solid blue line with circles). We use vertical dashed black lines to mark four TNG100 snapshots, separated by Δtcosmic ≈ 1 Gyr. Although at z ≈ 0 the abundances in TNG100 are a factor of ∼2 higher than the observed in SDSS, at higher redshifts the space density of CGs in TNG100 is consistent with that reported by observational works. |
| In the text | |
|
Fig. 5. Evolution of CG mean surface brightness, split by CG identification redshift. Histograms of threshold times are shown in the top panels. From left to right, we show CGs identified at redshift z = 0.06, z = 0.14, and z = 0.23. The median of each is shown as a solid coloured line (dark red, magenta, and green, respectively). The vertical dotted black line indicates the identification time of each sample. CGs at different epochs evolve similarly: most cross the surface brightness threshold less than 1 Gyr before identification, reach maximum compactness shortly after, and then galaxies begin to orbit within the group. Post-identification evolution is highly diverse, reflecting the chaotic nature of these systems. |
| In the text | |
|
Fig. 6. Evolution of CG mean surface brightness in time relative to median threshold crossing. Shaded regions encompass the 25th-75th percentiles. Colours indicate samples identified at redshift z = 0.00 (blue), z = 0.06 (dark red), z = 0.14 (magenta), and z = 0.23 (green). The last point of each curve corresponds to the final snapshot, at tcosmic ≈ 13.8 Gyr. The horizontal dashed red line shows the threshold |
| In the text | |
|
Fig. 7. Percentages of CGs meeting a given CG selection criterion at z = 0, split by CG identification epoch. The sample of z = 0.06 is shown in dark red, the one of z = 0.14 in magenta, and that of z = 0.23 in green. The criteria analysed are compactness, isolation, richness, and all three simultaneously. While 68% of CGsz > 0 remain isolated by z = 0, only 33% are still conformed by at least four similar-mass galaxies. A small fraction of CGs remain as such at z = 0, with lower values shown by older samples. |
| In the text | |
|
Fig. 8. Two snapshots of the coalescing CG: when identified (top) and at present (bottom). This is the only group studied for which all members merge into a single galaxy before z = 0. The purple circles indicate the four members of the CG, while other dark regions indicate dwarf galaxies that do not have a stellar mass similar to the members of the CG. This CGz = 0.23 is the result of a close encounter between two pairs of galaxies: the two at the left (X ≈ −50 kpc), and the two at the right (X ≈ 60 kpc), which are very close in projection and show some signs of tidal interaction. Darker colours indicate a higher number density of particles. Images were generated with the Py-SPH Viewer library (Benítez-Llambay 2017). |
| In the text | |
|
Fig. 9. Distribution of number of galaxy mergers within CGs, split by identification epoch. While only 2/15 (∼14%) of CGsz = 0.06 experience one merger, the CGsz = 0.23 sample is the only in which most systems have experienced at least one merger. Coalescence of CGs that had Δt < 3 Gyr to evolve is somewhat infrequent. |
| In the text | |
|
Fig. B.1. Velocity dispersion as function of virial velocity for rich (N ≥ 4) groups of TNG100. We use the same 131 rich groups of Fig. 2. Lines show different σv, 1D/v200, c ratios, as indicated by the labels. |
| In the text | |
Current usage metrics show cumulative count of Article Views (full-text article views including HTML views, PDF and ePub downloads, according to the available data) and Abstracts Views on Vision4Press platform.
Data correspond to usage on the plateform after 2015. The current usage metrics is available 48-96 hours after online publication and is updated daily on week days.
Initial download of the metrics may take a while.