Fig. 3.
Download original image
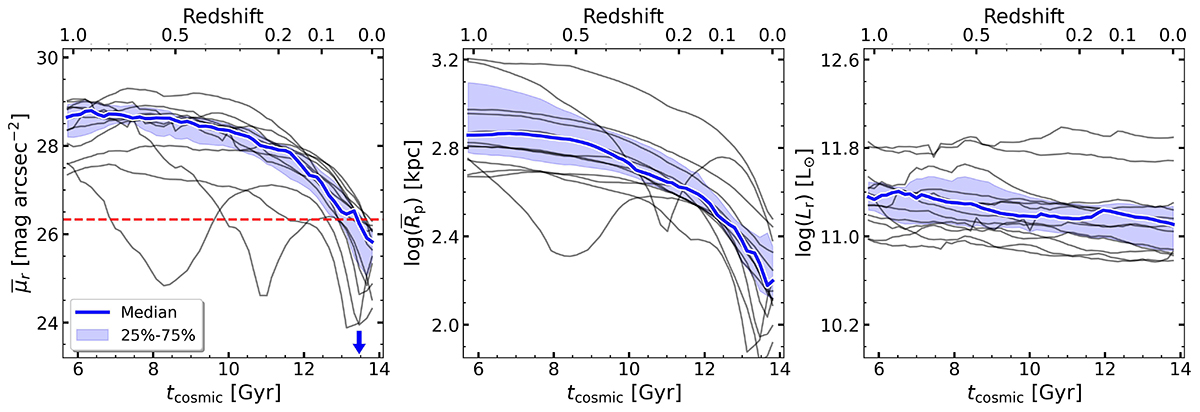
Evolution of CG properties. From left to right: i) Group surface brightness, ![]() ; ii) size,
; ii) size, ![]() ; and iii) total luminosity, Lr. Solid blue lines show the sample medians, and shaded regions encompass the 25th-75th percentiles. At the left panel, we show the threshold value,
; and iii) total luminosity, Lr. Solid blue lines show the sample medians, and shaded regions encompass the 25th-75th percentiles. At the left panel, we show the threshold value, ![]() , with a horizontal dashed red line, and the median threshold time, tthr, is represented with a blue arrow, indicating that more than 50% of the CGs became compact less than 1 Gyr ago. The other two panels show that surface brightness strongly correlates with size evolution, while luminosity mildly changes (Δ ∼ 0.2 dex).
, with a horizontal dashed red line, and the median threshold time, tthr, is represented with a blue arrow, indicating that more than 50% of the CGs became compact less than 1 Gyr ago. The other two panels show that surface brightness strongly correlates with size evolution, while luminosity mildly changes (Δ ∼ 0.2 dex).
Current usage metrics show cumulative count of Article Views (full-text article views including HTML views, PDF and ePub downloads, according to the available data) and Abstracts Views on Vision4Press platform.
Data correspond to usage on the plateform after 2015. The current usage metrics is available 48-96 hours after online publication and is updated daily on week days.
Initial download of the metrics may take a while.