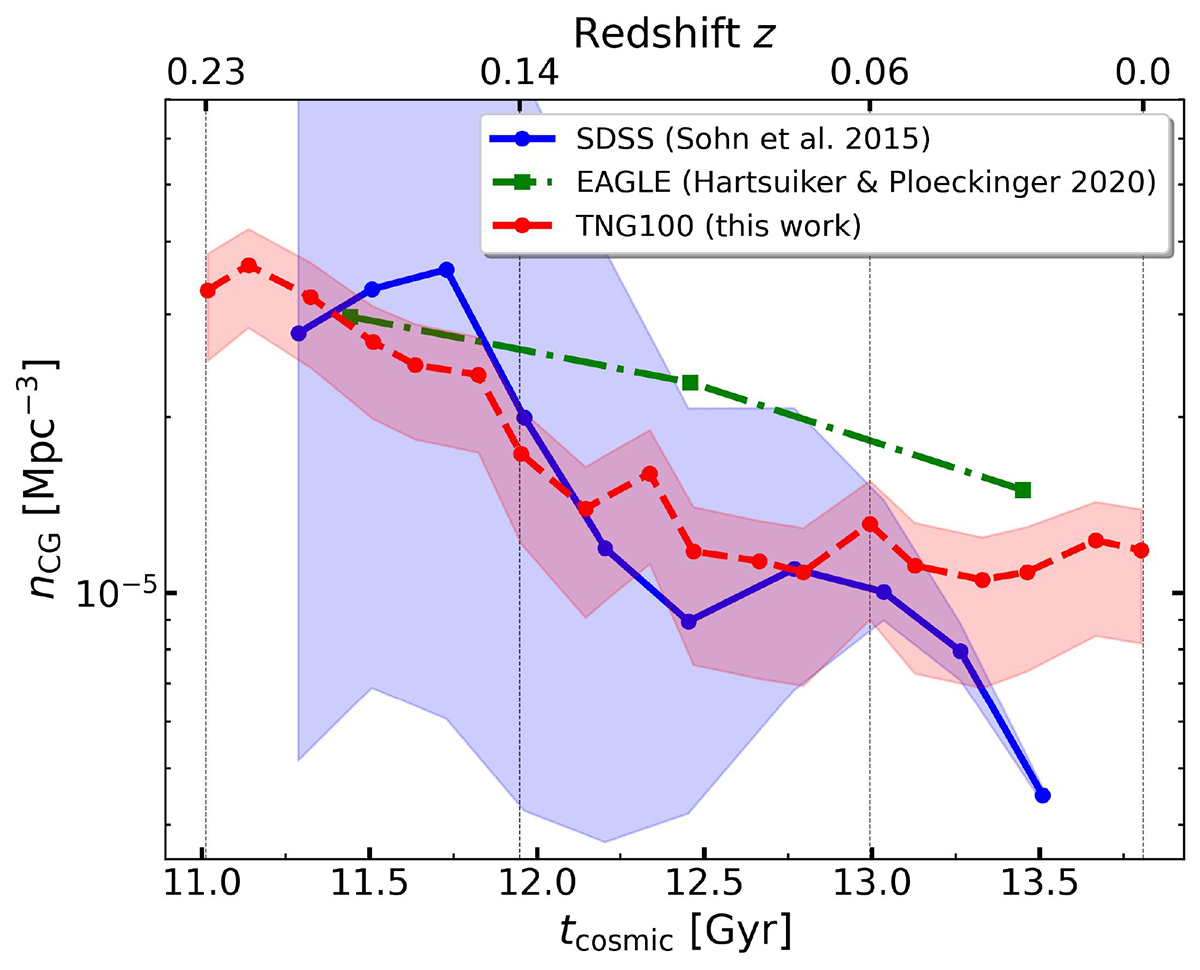
Fig. 4.
Download original image
Evolution of space density of CGs obtained in this work (TNG100, dashed red line with circles, shaded regions indicate Poisson errors), by Hartsuiker & Ploeckinger (2020, mock catalogue from EAGLE, dash-dotted green line with squares), and by Sohn et al. (2015, SDSS-DR12, solid blue line with circles). We use vertical dashed black lines to mark four TNG100 snapshots, separated by Δtcosmic ≈ 1 Gyr. Although at z ≈ 0 the abundances in TNG100 are a factor of ∼2 higher than the observed in SDSS, at higher redshifts the space density of CGs in TNG100 is consistent with that reported by observational works.
Current usage metrics show cumulative count of Article Views (full-text article views including HTML views, PDF and ePub downloads, according to the available data) and Abstracts Views on Vision4Press platform.
Data correspond to usage on the plateform after 2015. The current usage metrics is available 48-96 hours after online publication and is updated daily on week days.
Initial download of the metrics may take a while.