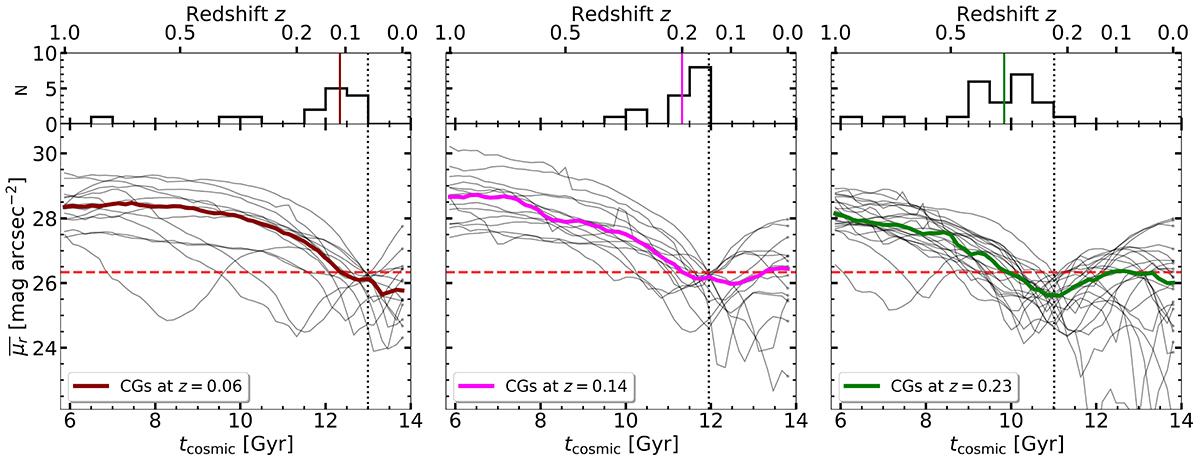
Fig. 5.
Download original image
Evolution of CG mean surface brightness, split by CG identification redshift. Histograms of threshold times are shown in the top panels. From left to right, we show CGs identified at redshift z = 0.06, z = 0.14, and z = 0.23. The median of each is shown as a solid coloured line (dark red, magenta, and green, respectively). The vertical dotted black line indicates the identification time of each sample. CGs at different epochs evolve similarly: most cross the surface brightness threshold less than 1 Gyr before identification, reach maximum compactness shortly after, and then galaxies begin to orbit within the group. Post-identification evolution is highly diverse, reflecting the chaotic nature of these systems.
Current usage metrics show cumulative count of Article Views (full-text article views including HTML views, PDF and ePub downloads, according to the available data) and Abstracts Views on Vision4Press platform.
Data correspond to usage on the plateform after 2015. The current usage metrics is available 48-96 hours after online publication and is updated daily on week days.
Initial download of the metrics may take a while.