Fig. 6.
Download original image
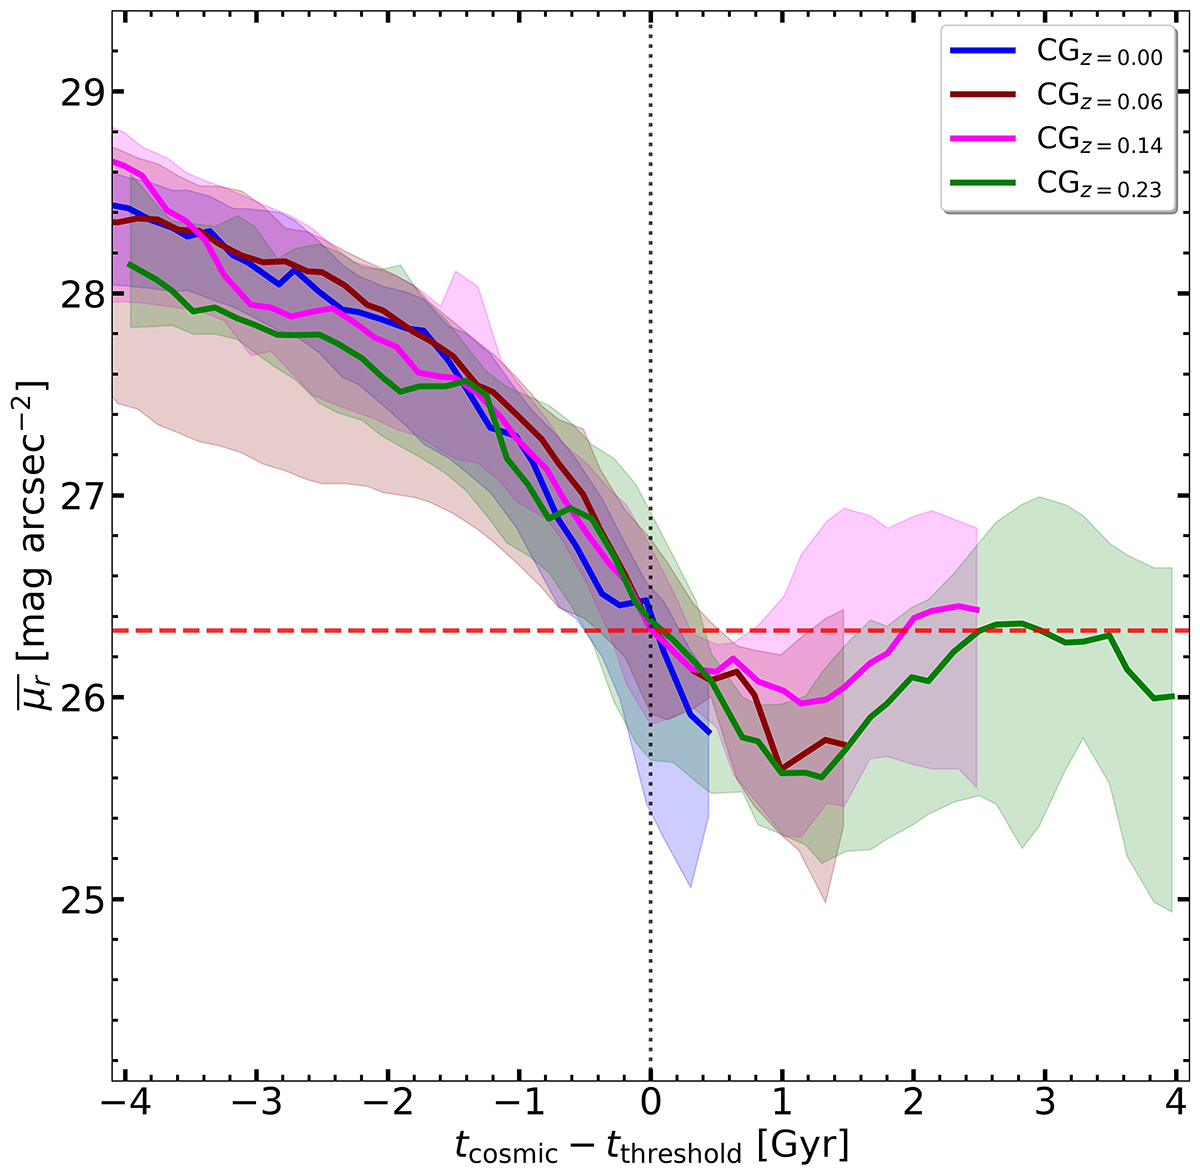
Evolution of CG mean surface brightness in time relative to median threshold crossing. Shaded regions encompass the 25th-75th percentiles. Colours indicate samples identified at redshift z = 0.00 (blue), z = 0.06 (dark red), z = 0.14 (magenta), and z = 0.23 (green). The last point of each curve corresponds to the final snapshot, at tcosmic ≈ 13.8 Gyr. The horizontal dashed red line shows the threshold ![]() and the vertical dotted black line indicates tcosmic = tthreshold. When shifted horizontally, all medians follow a similar trend: galaxies begin to inhabit the same halo, leading to the group assembly, a period of extreme compactness, and subsequent orbital evolution.
and the vertical dotted black line indicates tcosmic = tthreshold. When shifted horizontally, all medians follow a similar trend: galaxies begin to inhabit the same halo, leading to the group assembly, a period of extreme compactness, and subsequent orbital evolution.
Current usage metrics show cumulative count of Article Views (full-text article views including HTML views, PDF and ePub downloads, according to the available data) and Abstracts Views on Vision4Press platform.
Data correspond to usage on the plateform after 2015. The current usage metrics is available 48-96 hours after online publication and is updated daily on week days.
Initial download of the metrics may take a while.