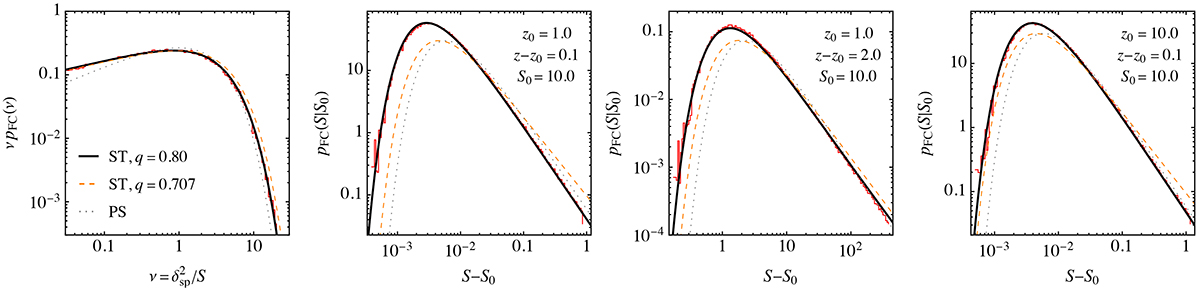
Fig. 1.
Download original image
Left panel: Unconditional first-crossing distribution for walks starting from S = 0, δ = 0. The histogram shows the results of random walks; the solid black and dashed orange curves show the ansatz (3) with q = 0.80 and q = 0.707, respectively; and the dotted grey curve shows the spherical collapse result. Other panels: Conditional first-crossing distribution at z > z0 for walks starting from S0 > 0 and δell(z0, S0) > 0 as indicated in the plot. The histogram again shows the results of random walks, the solid black curves show the ansatz (4), the dashed orange curves show the ansatz (3) with δsp(z)→δsp(z)−δsp(z0) and S → S − S0, and the dotted grey curve shows the spherical collapse result.
Current usage metrics show cumulative count of Article Views (full-text article views including HTML views, PDF and ePub downloads, according to the available data) and Abstracts Views on Vision4Press platform.
Data correspond to usage on the plateform after 2015. The current usage metrics is available 48-96 hours after online publication and is updated daily on week days.
Initial download of the metrics may take a while.