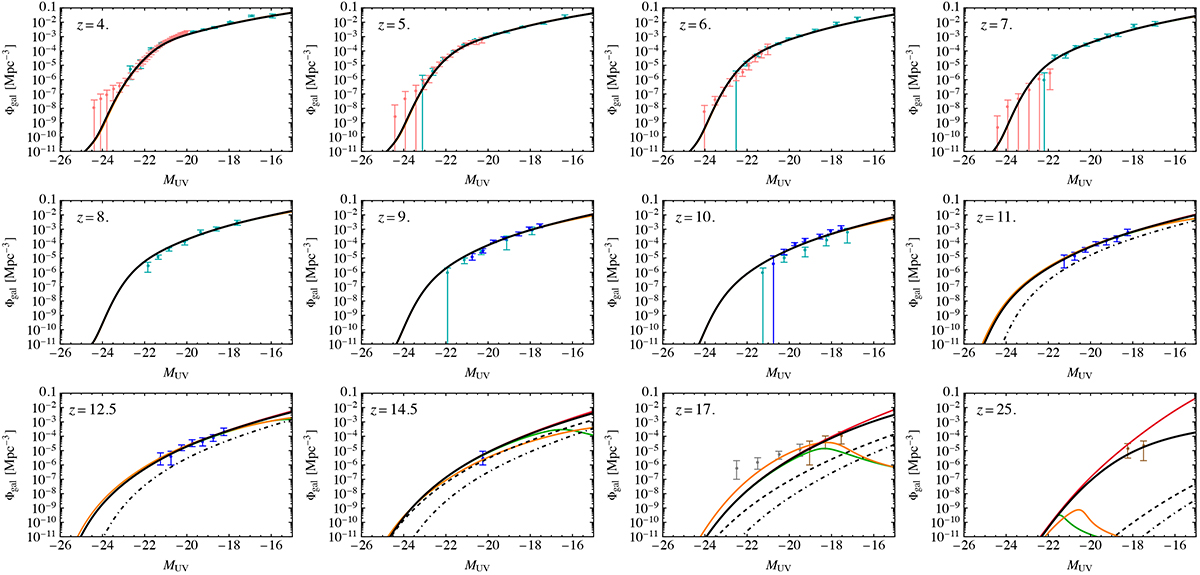
Fig. 8.
Download original image
UV luminosity function at different redshifts in the cold (black), fuzzy (green), and warm (orange) DM models and in the model with enhanced matter power (red). The best fit is shown for CDM and WDM cases, while for FDM the mass corresponds to the 95% lower bound. The dashed and dot-dashed curves show the CDM UV luminosity function without the suppression of the feedback effects and without the change in the UV conversion factor κUV. The points with errorbars show the HST measurements from Bouwens et al. (2021) (cyan) and Harikane et al. (2022) (pink) and the JWST measurements from Donnan et al. (2024) (blue), Pérez-González et al. (2025) (brown), and Castellano et al. (2025) (grey).
Current usage metrics show cumulative count of Article Views (full-text article views including HTML views, PDF and ePub downloads, according to the available data) and Abstracts Views on Vision4Press platform.
Data correspond to usage on the plateform after 2015. The current usage metrics is available 48-96 hours after online publication and is updated daily on week days.
Initial download of the metrics may take a while.